. 2025 Jul;31(3):914-934.
doi: 10.3350/cmh.2024.1038. Epub 2025 Feb 6.

GULP1 as a novel diagnostic and predictive biomarker in hepatocellular carcinoma

Affiliations

GULP1 as a novel diagnostic and predictive biomarker in hepatocellular carcinoma

Hyung Seok Kim et al. Clin Mol Hepatol. 2025 Jul.

Abstract

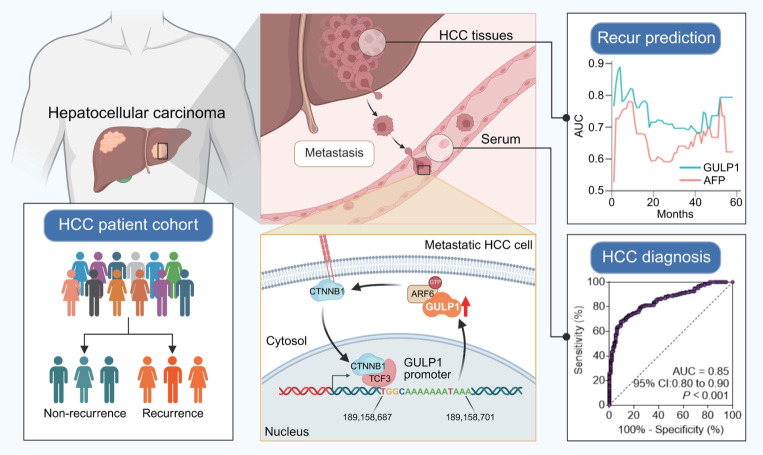
Background/aims: Hepatocellular carcinoma (HCC) is characterized by high recurrence and mortality, necessitating the identification of reliable biomarkers. In this study, we aimed to identify the predictive gene signatures for HCC recurrence and evaluate the efficiency of GULP PTB domain-containing engulfment adaptor 1 (GULP1) as a predictive and diagnostic marker and therapeutic target for HCC.

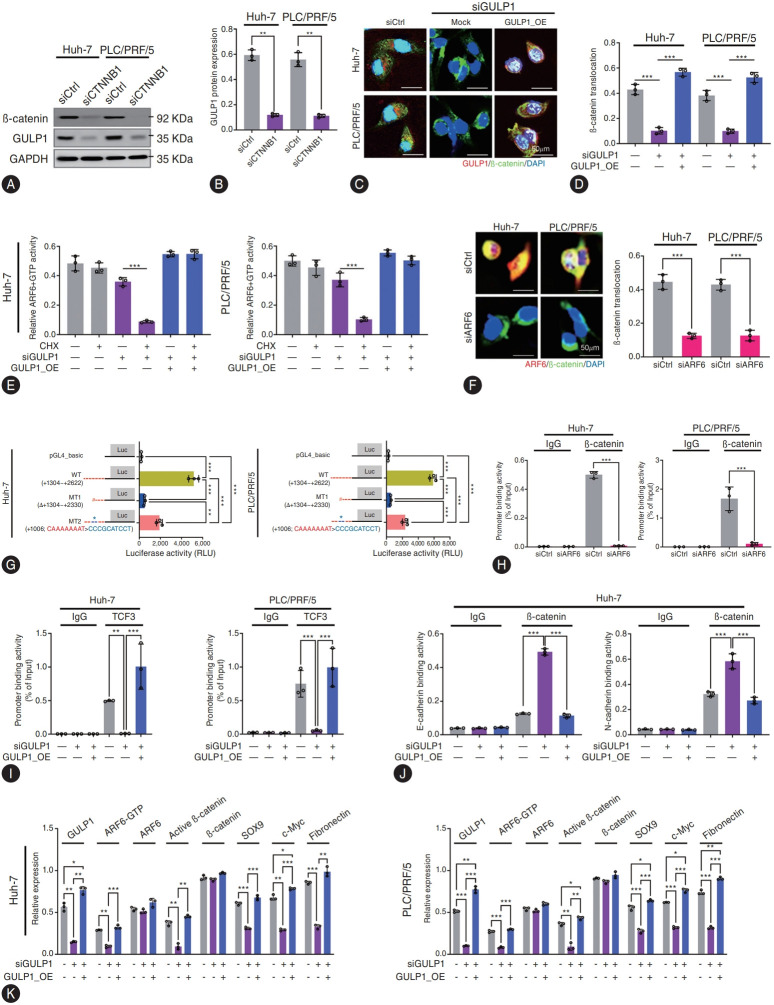
Methods: We analyzed genomic datasets from The Cancer Genome Atlas and Gene Expression Omnibus databases via least absolute shrinkage and selection operator Cox regression and 10-fold cross-validation, leading to the development of a 15-gene risk score model, which was validated using three independent datasets. Serum GULP1 and α-fetoprotein levels were assessed to determine the diagnostic accuracy of the model. Using clinical cohorts and patient sera, GULP1 roles were examined, and functional assays in vitro and in vivo were used to evaluate its effects on cell growth, epithelial-mesenchymal transition (EMT), ADP-ribosylation factor 6 (ARF6) activation, and β-catenin signaling.

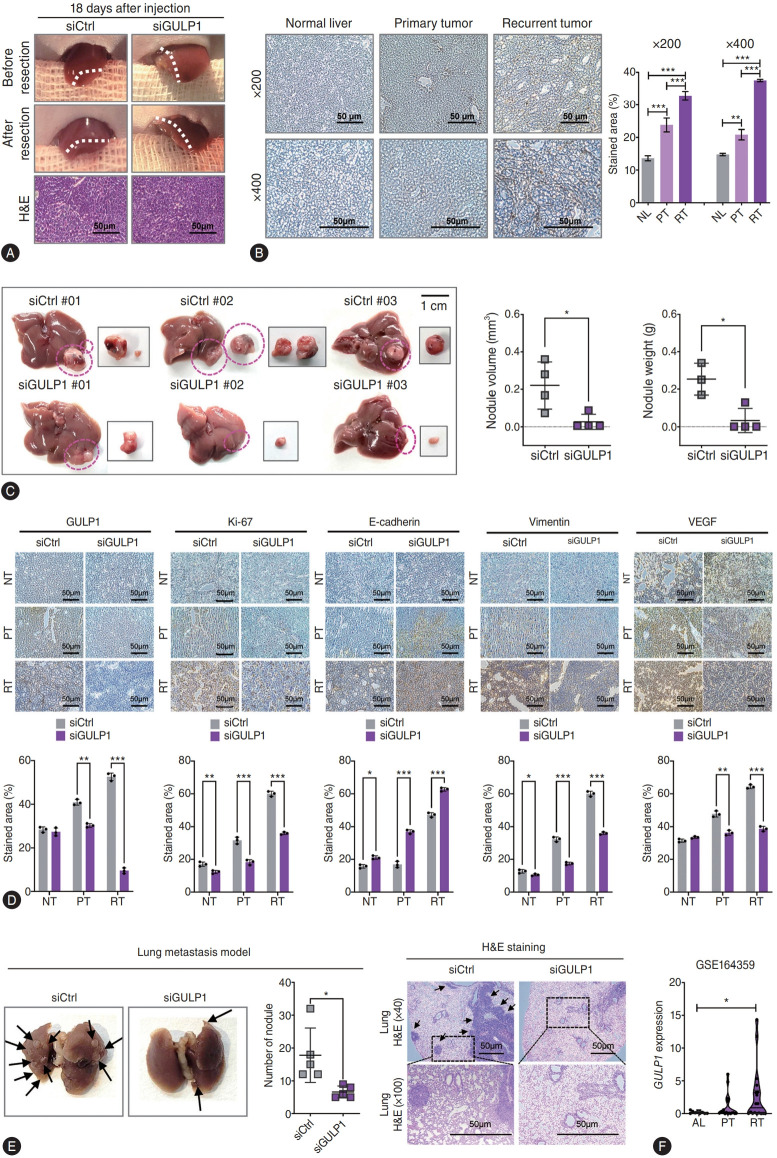
Results: Our newly developed risk-score model accurately predicted recurrent HCC in all datasets. Among the 15 genes in the risk score model, GULP1 was overexpressed in patients with HCC and independently predicted HCC recurrence. Its expression modulation influenced cell growth and EMT, with observed effects on ARF6 activation and β-catenin signaling pathways.

Conclusion: GULP1 is a crucial biomarker for HCC, serving as a non-invasive diagnostic and predictive tool. It also plays key roles in HCC progression. Our findings highlight the potential use of GULP1 in treatment strategies targeting EMT and HCC recurrence to improve the personalized care and patient outcomes.

Keywords: Diagnosis; GULP PTB domain-containing engulfment adaptor 1; Liver cancer; Metastasis; Recurrence.


Conflict of interest statement

Conflicts of Interest

The authors have no conflicts to disclose.

Figures

Figure 1.
Figure 1.
Identification of differentially expressed genes (DEGs) in recurrent hepatocellular carcinoma (HCC), and development of a risk score (RS) model. (A) Flow chart of the selection of genes associated with recurrent HCC. Patient selection criteria included patients who underwent surgical liver resection and remained recurrence-free for over two years (non-recurrence [NR]) and those who experienced recurrence (R). (B) Left: Coefficient profiles of correlated DEGs in least absolute shrinkage and selection operator (LASSO) analysis. Right: LASSO model parameter adjustment with 10-fold cross-validation. Blue dashed line indicates the optimal lambda value cutoff (0.1829059). (C) Correlation analysis of RS and patient survival using three HCC datasets: GSE14520, GSE114564, and The Cancer Genome Atlas (TCGA) liver hepatocellular carcinoma (LIHC). (D) Predictive potency determined via receiver operating characteristic (ROC) analysis. (E) Risk-based analysis of recurrence-free survival (RFS) in the GSE14520, GSE114564, and TCGA LIHC datasets using the Kaplan–Meier approach. (F) Forest plots of univariate Cox regression analyses of clinical parameters affecting RFS. HCC differentiation was defined using the Edmondson grade scale. Statistical significance was determined via Cox proportional hazards regression analysis and log-rank tests for survival data. AFP, α-fetoprotein; AJCC, The American Joint Committee on Cancer; AUC, area under the curve; HR, hazard ratio. *P<0.05, **P<0.01, ***P<0.001.
Figure 2.
Figure 2.
GULP1 is a hepatocellular carcinoma (HCC) progression indicator. (A) Heatmap of GULP1 expression levels (Z-score of log2[TPM+1]) in the normal, adjacent non-HCC (ADJ_HCC), and HCC tissues across 22 datasets from GepLiver DB. (B) Comparison of GULP1 expression levels across different liver phenotypes using data from GepLiver DB (normal=362; viral hepatitis=180; nonalcoholic fatty liver disease (NAFLD)=503; cirrhosis=63; HCC=724). (C) Spatial transcriptomic analysis of the tumor tissues. GULP1 expression levels were notably higher in the malignant hepatocytes (purple) of the same tissue, with minimal to no expression observed in the nonmalignant hepatocytes (yellow). P9T and P10T indicate the unique patient IDs. (D) Proportion of GULP1-positive cells (%) across all analyzed tumor tissues from spatial transcriptomics. The labels (P1T, P2T, etc.) indicate patient IDs. (E) Uniform manifold approximation and projection (UMAP) plot of an integrated liver single-cell RNA-sequencing (scRNA-seq) dataset from GepLiver DB. Left: Cells colored by major cell type, indicating the distribution of cell types (e.g., hepatocytes, cholangiocytes, and immune cells) across different phenotypes. Right: Proportion of GULP1-positive cells (%) among hepatocytes in the normal, ADJ_HCC, and HCC tissues. (F) Left: UMAP plot of scRNA-seq data from the scAtlasLC database. Right: Proportion of GULP1-positive cells (%) among non-malignant and malignant hepatocytes from the scAtlasLC database. (G) Mean expression levels of GULP1 in different liver-associated cell types in the GSE151530 dataset. (H) UMAP plot showing the GULP1-positive (+) and GULP1-negative (−) hepatocytes among the analyzed 18,539 hepatocytes. (I) Enrichment score plots of the hallmark pathways with GULP1-positive hepatocytes derived via single-sample gene set enrichment analysis (ssGSEA). EMT, epithelial–mesenchymal transition; MDSCs, myeloid-derived suppressor cells.
Figure 3.
Figure 3.
Clinical significance of GULP PTB domain-containing engulfment adaptor 1 (GULP1) expression in hepatocellular carcinoma (HCC). (A) GULP1 levels in the paired tissue (left) and blood (right) samples. GULP1 levels were significantly elevated in the HCC tissues and serum samples of patients with HCC compared to those in the non-tumor (NT) groups. Receiver operating characteristics (ROC) analysis showed the high diagnostic accuracy of serum GULP1 in distinguishing HCC from NT and early liver disease cases. (B) ROC analysis results of GULP1 and α-fetoprotein (AFP) in high-risk liver disease groups (CH/LC) and across modified Union for International Cancer Control (mUICC) stages. (C) Left: Comparison of the serum GULP1 and AFP positivity rates among different groups (NL, chronic hepatitis [CH], liver cirrhosis [LC], and HCC). Right: Positivity rates of AFP, GULP1, and their combination in patients with liver cancer. (D) Comparison of GULP1 levels in recurrent (R) vs. non-recurrent (NR) cases using the tissue (left panels) and serum (right panels) samples. GULP1 levels are elevated in R cases, showing superior time-dependent predictive performance in tissues and comparable but slightly higher performance than AFP in the serum samples for recurrence prediction. (E) Left: Western blotting analysis of GULP1 protein levels in the primary tumor tissues (PTs) and recurrent tumor tissues (RTs) of three patients. #P01, #P02, and #P03 indicate the unique IDs of patients with HCC. Right: Densitometry analysis shows the increased GULP1 levels in recurrent tumors. (F) Recurrencefree survival (RFS) analysis based on GULP1 expression in the tissue (left) and serum (right) samples. High GULP1 expression was associated with significantly poor prognosis in both tissue and serum evaluations in the validation cohort. Statistical significance was determined via unpaired t-tests for within-group comparisons and one-way analysis of variance (ANOVA) for multi-group comparisons. ROC curve analysis was performed for diagnostic evaluations. Data are represented as the mean±standard error of the mean. *P<0.05, **P<0.01, ***P<0.001.
Figure 4.
Figure 4.
Targeted inactivation of GULP PTB domain-containing engulfment adaptor 1 (GULP1) suppressed the tumorigenic potential of liver cancer cells. (A) Effects of GULP1 modulation on HCC cell growth, proliferation, and colony formation. Left: 3-(4,5-Dimethylthiazol- 2-yl)-2,5-diphenyltetrazolium bromide (MTT) assay showed the regulated cell growth of PLC/PRF/5 and Huh-7 cells upon the alteration of GULP1 expression. Middle: 5-Bromo-2′-deoxyuridine (BrdU) incorporation assay indicated the regulated proliferation of GULP1-modulated cells. Right: Clonogenic assay revealed the significantly lower colony formation capacity of siGULP1-treated cells compared to that of the controls. (B) Left: Subcutaneous xenograft tumor growth assay revealed that the GULP1-depleted Huh-7 cells exhibited significantly lower growth rates than the control cells. Right: Tumor weight differences in xenografts with GULP1 knockdown. (C) Left: Histopathological examination of tumor sections via hematoxylin and eosin (H&E) staining and immunohistochemistry (IHC) for GULP1, Ki67, and proliferating cell nuclear antigen (PCNA). Right: Inter-group comparative analysis of IHC staining intensity for GULP1, Ki67, and PCNA. (D) Scratch wound-healing assay revealed the effect of GULP1 on cell migration. Left: Representative images of wound closure in PLC/ PRF/5 and Huh-7 cells at 24-hour post-scratch. Right: Quantification of wound closure, showing significantly regulated migration of GULP1-modulated cells. (E) Effects of GULP1 on cell invasion and sphere formation. Left: Invasion assay showed the altered invasiveness of PLC/PRF/5 and Huh-7 cells after GULP1 modulation. Right: Sphere formation assay revealed the significant changes in sphere formation and cell outgrowth upon altered GULP1 expression, with enlarged images highlighting the reduced lamellipodia (arrows). (F) IHC images showing the expression patterns in HCC tissues derived from the subcutaneous xenografts injected with GULP1-depleted Huh7 cells. Statistical significance was determined via unpaired t-tests for comparisons between two groups. siCtrl, scrambled sequence of single interference control RNA; siGULP1, small interfering RNA targeting GULP1; GULP1_OE, GULP1 overexpression. *P<0.05, **P<0.01, ***P<0.001.
Figure 5.
Figure 5.
Validation of GULP PTB domain-containing engulfment adaptor 1 (GULP1) effects on epithelial–mesenchymal transition (EMT) and hepatocellular carcinoma (HCC) recurrence in vivo. (A) Schematic representation of the experiment illustrating the orthotopic injection of GULP1-suppressed Hepa1-6 cells into the mouse liver. (B) Immunohistochemistry (IHC) analysis showing the significant increase in GULP1 expression levels, particularly in the recurrence tumors compared to those in the normal liver (NL) and primary tumors. Magnifications: 200× and 400×. (C) Left: Representative images of the livers with tumor burden from different groups (siCtrl and siGULP1). Right: Corresponding bar graphs on the right show the calculated nodule volume and weight. (D) Top: IHC analysis of various markers in the NT, primary tumor (PT), and recurrent tumor (RT) tissues. Bottom: Quantification of stained GULP1, Ki-67, E-cadherin, vimentin, and vascular endothelial growth factor (VEGF) expression levels. Proliferation marker: Ki-67. Epithelial marker: E-cadherin. Mesenchymal marker: Vimentin. Angioinvasion marker: VEGF. (E) Lung metastasis model using ras-transformed NIH-3T3 cells with siCtrl or siGULP1 treatment. Left: Lung nodules (arrows) are significantly reduced in the siGULP1-treated tissues. Right: H&E-stained images at 40× and 100× magnification show the dispersed HCC cells (arrows) in siCtrl-treated lungs, whereas siGULP1-treated lungs show improved morphology. Scale bars=50 μm. (F) Analysis of RNA-seq data from the GSE164359 dataset revealed higher GULP1 levels in RT samples than in the adjacent liver tissue (AL) and PT samples. Statistical significance was determined via unpaired t-tests for comparisons between two groups. Data are represented as the mean±standard error of the mean. siCtrl, scrambled sequence of single interference control RNA; siGULP1, small interfering RNA targeting GULP1. *P<0.05, **P<0.01, ***P<0.001.
Figure 6.
Figure 6.
Mechanistic role of GULP PTB domain-containing engulfment adaptor 1 (GULP1) in β-catenin signaling pathway regulation in hepatocellular carcinoma (HCC). (A) Western blotting analysis revealed that β-catenin suppression considerably decreased the GULP1 protein levels in the HCC cell lines, Huh-7 and PLC/PRF/5. The cells were treated with the CTNNB1-targeting siRNA (siCTNNB1) or siCtrl. (B) Quantification of GULP1 protein levels via enzyme-linked immunosorbent assay (ELISA) after β-catenin suppression in HCC cell lines. Data indicate the significant reduction in GULP1 expression upon β-catenin knockdown. (C) Immunofluorescence (IF) microscopy images illustrating β-catenin nuclear translocation influenced by GULP1 expression in Huh-7 and PLC/PRF/5 cells. siGULP1 or GULP1 overexpressing vector (GULP1_OE) treatment was performed, with nuclei stained with 4′, 6-diamidino-2-phenylindole (DAPI). (D) Quantitative representation of β-catenin translocation normalized to that of histone H3, corresponding to the microscopy findings. Data indicate that GULP1 modulates β-catenin localization. (E) ELISA of the modulation of ARF6-GTP levels in response to changes in GULP1 levels under conditions where protein synthesis was inhibited by cycloheximide (CHX). Expression of ARF6-GTP was normalized to that of total ARF6. siGULP1 and GULP1_OE treatments showed that GULP1 stabilized ARF6-GTP. (F) Visualization of β-catenin nuclear translocation via IF microscopy (left), with accompanying quantitative analysis (right). Suppression of β-catenin localization upon ARF6 knockdown using the ARF6-targeting siRNA (siARF6) supported the critical role of ARF6 in GULP1-mediated β-catenin translocation. (G) Luciferase activity in Huh7 cells transfected with the wild-type (WT) GULP1 promoter construct, first mutant (MT1) with a deletion from +1304 to +2330, and second mutant (MT2) with a sequence alteration at +1006 (CCCGCATCCT). WT construct showed significantly higher activity than MT1 and MT2. (H) Chromatin immunoprecipitation (ChIP) assays showing the decreased binding affinity of β-catenin to the GULP1 promoter region upon ARF6 knockdown in Huh-7 and PLC/PRF/5 cells. (I) Modulation of TCF3 binding affinity to the GULP1 promoter region in response to changes in GULP1 expression. ChIP assay was performed to measure the binding activity. (J) Immunoprecipitation revealed β-catenin nuclear translocation and its enhanced interaction with the key adhesion molecules, N-cadherin and E-cadherin, following GULP1 modulation in Huh-7 and PLC/PRF/5 cells. (K) ELISA showing the expression levels of downstream β-catenin targets, such as SRY-box transcription factor 2 (SOX9), c-Myc, and fibronectin, in response to altered GULP1 expression in Huh-7 and PLC/PRF/5 cells. These results indicate that GULP1 influences the expression levels of these targets via its regulatory effects on β-catenin signaling. Unpaired t-tests were used to determine the statistical significance. Data are represented as the mean±standard error of the mean. ARF6, ADP-ribosylation factor 6; siCtrl, scrambled sequence of single interference control RNA; siGULP1, small interfering RNA targeting GULP1. *P<0.05, **P<0.01, ***P<0.001.
Figure 7.
Figure 7.
Schematic diagram of the GULP PTB domain-containing engulfment adaptor 1 (GULP1)–β-catenin co-regulatory mechanism in hepatocellular carcinoma (HCC). GULP1 functions as a crucial modulator in the β-catenin signaling axis in HCC that is critical for the stabilization of ARF6-GTP, which further influences the cellular distribution of β-catenin. This stabilization facilitates β-catenin release and subsequent nuclear translocation, where it binds to TCF3 at the GULP1 promoter region, impacting gene transcription. Downstream effects of this binding include enhanced cell proliferation, EMT, and tumor recurrence, which contribute to liver tumorigenesis. ARF6, ADPribosylation factor 6; EMT, epithelial–mesenchymal transition; TCF3, transcription factor 3.
None

References

    1. Vogel A, Meyer T, Sapisochin G, Salem R, Saborowski A. Hepatocellular carcinoma. Lancet. 2022;400:1345–1362. - PubMed
    1. Mashiba T, Joko K, Kurosaki M, Ochi H, Hasebe C, Akahane T, et al. Real-world efficacy of elbasvir and grazoprevir for hepatitis C virus (genotype 1): A nationwide, multicenter study by the Japanese Red Cross Hospital Liver Study Group. Hepatol Res. 2019;49:1114–1120. - PMC - PubMed
    1. Huang DQ, Mathurin P, Cortez-Pinto H, Loomba R. Global epidemiology of alcohol-associated cirrhosis and HCC: trends, projections and risk factors. Nat Rev Gastroenterol Hepatol. 2023;20:37–49. - PMC - PubMed
    1. Bruix J, Takayama T, Mazzaferro V, Chau GY, Yang J, Kudo M, et al. Adjuvant sorafenib for hepatocellular carcinoma after resection or ablation (STORM): a phase 3, randomised, doubleblind, placebo-controlled trial. Lancet Oncol. 2015;16:1344–1354. - PubMed
    1. Beyer AS, von Einem B, Schwanzar D, Keller IE, Hellrung A, Thal DR, et al. Engulfment adapter PTB domain containing 1 interacts with and affects processing of the amyloid-β precursor protein. Neurobiol Aging. 2012;33:732–743. - PubMed

MeSH terms

LinkOut - more resources