. 2025 May;641(8061):211-221.
doi: 10.1038/s41586-025-08713-9. Epub 2025 Feb 6.

Granzyme K activates the entire complement cascade

Collaborators, Affiliations

Granzyme K activates the entire complement cascade

Carlos A Donado et al. Nature. 2025 May.

Abstract

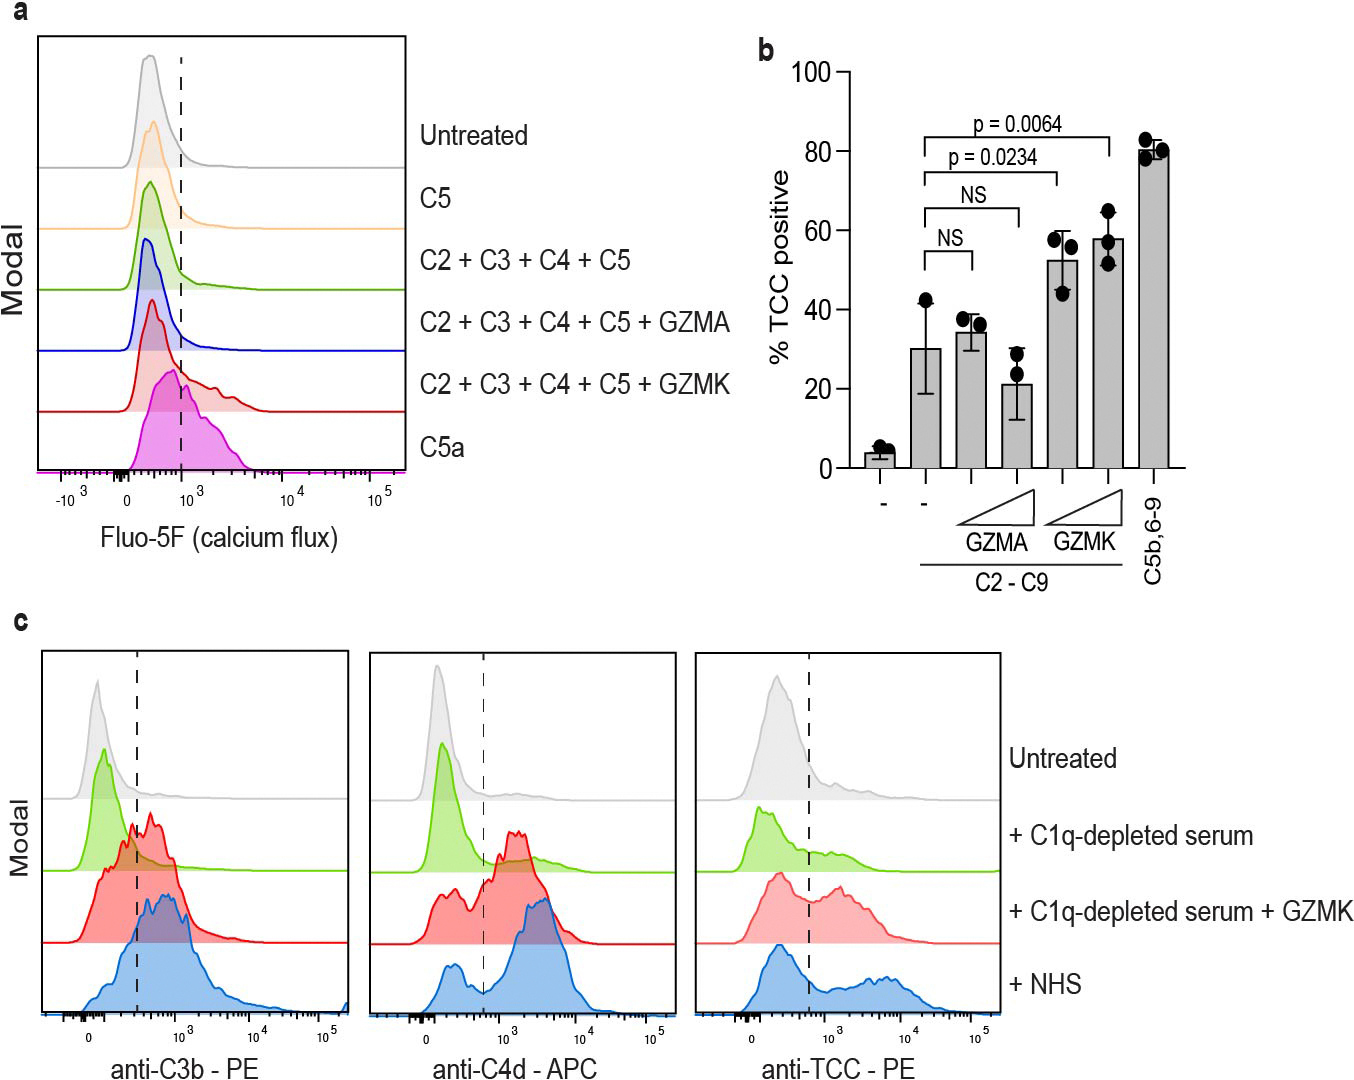
Granzymes are a family of serine proteases that are mainly expressed by CD8+ T cells, natural killer cells and innate-like lymphocytes1. Although their primary function is thought to be the induction of cell death in virally infected cells and tumours, accumulating evidence indicates that some granzymes can elicit inflammation by acting on extracellular substrates1. We previously found that most tissue CD8+ T cells in rheumatoid arthritis synovium, and in inflamed organs for some other diseases, express granzyme K (GZMK)2, a tryptase-like protease with poorly defined function. Here, we show that GZMK can activate the complement cascade by cleaving the C2 and C4 proteins. The nascent C4b and C2b fragments form a C3 convertase that cleaves C3, enabling the assembly of a C5 convertase that cleaves C5. The resulting convertases generate all the effector molecules of the complement cascade: the anaphylatoxins C3a and C5a, the opsonins C4b and C3b, and the membrane attack complex. In rheumatoid arthritis synovium, GZMK is enriched in regions with abundant complement activation, and fibroblasts are the main producers of complement proteins that serve as substrates for GZMK-mediated complement activation. Furthermore, Gzmk-deficient mice are significantly protected from inflammatory disease, exhibiting reduced arthritis and dermatitis, with concomitant decreases in complement activation. Our findings describe the discovery of a previously unidentified mechanism of complement activation that is driven entirely by lymphocyte-derived GZMK. Given the widespread abundance of GZMK-expressing T cells in tissues in chronic inflammatory diseases, GZMK-mediated complement activation is likely to be an important contributor to tissue inflammation in multiple disease contexts.


Conflict of interest statement

Competing interests: M.B.B. is a consultant to GSK, Third Rock Ventures, 4FO Ventures and Moderna and a consultant to and founder of Mestag Therapeutics. S.R. is a founder of Mestag Therapeutics, a scientific adviser for Janssen and Pfizer, and a consultant to Gilead and Rheos Medicine. D.F.D. is a consultant to Celldex Therapeutics. The remaining authors declare no competing interests.

Figures

Extended Data Fig. 1 |
Extended Data Fig. 1 |. GZMK is expressed by CD8+ T cells in many different inflamed and non-inflamed tissues.
a, Expression of T cell subset markers CCR7 and CD45RA by GZMK+ CD4+ and CD8+ T cells, respectively. Data are mean ± s.d. b, Expression of selected markers in UMAP space for the integrative dataset presented in Fig. 1g. c, Contribution of each of the six publicly available single-cell RNA-seq datasets to the integrated dataset of CD4+, CD8+, and NK cell profiles. d, Expression levels of selected genes by cell profiles the integrative dataset in UMAP space. e, Percentage of cells in all CD4+ T cell clusters (gray columns) or all CD8+T cell clusters (blue columns) with detectable GZMB gene expression, stratified by tissue and disease source. f, Aggregate data showing frequency of intracellular GZMK and GZMB staining among purified primary human CD8+ T cells cultured either in media alone (unstimulated) or with anti-CD3/CD28 antibody-coated beads for four days. Data in f show mean ± s.d. of four donors from a representative out of four independent experiments.
Extended Data Fig. 2 |
Extended Data Fig. 2 |. GZMK is highly homologous to complement factor D, C1s, and MASP1 but does not cleave factor B.
a, Results of a protein blast comparing the protein sequence of GZMK to all human protein sequences. b,d,e, Structural alignments showing the structural similarity between GZMK (cyan) and (b) complement factor D (CFD) (gray), (d) C1s (yellow, catalytic domain) and (e) MASP1 (green, catalytic domain). Alignments on the bottom show a close up of the catalytic triad residues in the active site of GZMK, CFD, C1s and MASP1. The catalytic residues in GZMK (H67, D116, S214) are labeled, while the corresponding catalytic triad residues in CFD (H66, D14, S208), C1s (H475, D529, S632) and MASP1 (H490, D552, S646) are shown but not labeled. Note that the catalytic serine in the structures of GZMK and CFD is mutated to alanine. c, Serum-purified complement factor B (CFB) was incubated with either CFD or increasing concentrations of GZMK in the presence or absence of C3b and cleavage products were analyzed by immunoblot. Serum-purified Bb was used as a control to identify cleavage of CFB into Bb. (c) Data are representative of three independent experiments.
Extended Data Fig. 3 |
Extended Data Fig. 3 |. GZMK cleaves C4 and C2 into C4b and C2b but does not directly cleave C3.
a, Densitometric analysis of the immunoblot shown in Fig. 2b depicts a dose-dependent increase in the cleavage of C4 into C4b as more GZMK is incubated with C4. b, Densitometric analysis of the immunoblot shown in Fig. 2c depicts a dose-dependent increase in the cleavage of C2 into C2b as more C4 is incubated with GZMK and C2. c,d, Densitometric analysis of the immunoblots shown in Fig. 2d and Fig. 2e showing a dose-dependent increase in the generation of (c) C3a and (d) C3b as more GZMK is incubated with C2 + C3 + C4. e, Serum-purified C3 was incubated with increasing concentrations of GZMK and cleavage products were assessed by immunoblot. As a positive control for C3 cleavage, C3 was incubated with C3b + CFB + CFD in the presence of increasing concentrations of properdin. Serum-purified C3b was used to confirm the presence of the C3b cleaved fragment. (a-e) Data are representative of at least three independent experiments.
Extended Data Fig. 4 |
Extended Data Fig. 4 |. GZMK binds plasma membranes to trigger formation of membrane-bound C3 convertases.
a, HUVEC cells, synovial fibroblasts and THP-1 monocytes were left untreated or were treated with an isotype control or a cell-type specific sensitizing antibody (anti-HLA-A,B,C for fibroblasts, anti-CD31 for HUVEC and THP-1 cells). Cells were then incubated with either C1s or the C1 complex and surface C1s was measured by flow cytometry. b, HUVEC cells were incubated for 4 hours with serum-purified C2 + C3 + C4 alone or in combination with GZMK or GZMA, and C3b deposition was measured by flow cytometry. Histograms depict representative data. Aggregate data is shown in Fig. 4c. c, Association plots of the geometric mean fluorescence intensity of surface staining of anti-heparan sulfate and anti-granzyme K antibodies from three HUVEC donors and cell subsets from four PBMC donors. Graph on the right shows PBMC cell subsets only. Statistics by Spearman correlation. d, Histograms of anti-heparan sulfate (left) and anti-granzyme K (right) antibody binding to the surfaces of unfixed, live cells of the indicated subset from a representative donor. Gray histograms depict cells in media; red histograms depict cells incubated with exogenous recombinant GZMK. e, HUVEC cells were incubated for 4 hours with serum-purified C2 + C3 + C4 alone or in combination with GZMK in the presence or absence of heparin and surface-bound GZMK and C3b were measured by flow cytometry. Aggregate data is shown in Fig. 4d. f, Densitometric analysis of the immunoblots shown in Fig. 4e depicting that GZMK is more efficient at cleaving C4, C2 and eliciting the generation of C3a when it is bound to membranes than when it is in the fluid phase. (a,b,e,f) Data are representative of at least three independent experiments.
Extended Data Fig. 5 |
Extended Data Fig. 5 |. GZMK triggers formation of C5 convertases that generate bioactive C5a and the terminal complement complex (TCC).
a, C5aR1-expressing Chem-1 reporter cells labeled with Fluo-5F were incubated with C5, C5a or the supernatants obtained after incubating HUVEC cells with C2 + C3 + C4 + C5 with or without GZMA or GZMK. Calcium flux was immediately assessed by flow cytometry. Aggregate data is shown in Fig. 4g. b, HUVEC cells were incubated with serum-purified C2 + C3 + C4 + C5 + C6 + C7 + C8 + C9 with increasing amounts of GZMK or GZMA in the presence of dynasore to inhibit endocytosis. C5b,6–9 was used as the positive control. Terminal complement complex formation (TCC) was then measured by flow cytometry. Data are mean ± s.d of three independent experiments. P values were calculated using one-way analysis of variance (ANOVA) with Dunnett’s multiple comparisons tests. NS = not significant. c, Surface deposition of C3b (left), C4d (middle) and TCC formation (right) on HUVEC cells after incubation with C1q-depleted serum and increasing concentrations of GZMK, as measured by flow cytometry. NHS was used as a positive control. Histograms depict representative data. Aggregate data is shown in Fig. 4i. All data are representative of at least three independent experiments.
Extended Data Fig. 6 |
Extended Data Fig. 6 |. In RA synovial tissue complement activation products are abundant in areas rich in GZMK.
a, Representative image showing immunofluorescence staining of RA synovial tissue with antibodies against C3d (clone C3D/2891, yellow in top composite), C5a (clone 2952, yellow in bottom composite), and GZMK (red) as well as Hoechst nuclear stain (blue). The area inside the dashed box is shown enlarged in Fig. 5a. Scale bar, 50 μm. b, Representative image showing immunofluorescence staining of RA synovial tissue with antibodies against GZMK (red) and C3d (clone 7C10, yellow) as well as Hoechst nuclear stain (blue). Scale bar, 50 μm. c, Enlarged view of area inside box in panel a. Scale bar, 25 μm. d, Representative image showing immunofluorescence staining of RA synovial tissue with antibodies against GZMK (red) and C5a (clone 2942, yellow) as well as Hoechst nuclear stain (blue). Scale bar, 50 μm. e, Enlarged view of area inside box in panel a. Scale bar, 25 μm. All images in this panel are tiled images collected on a confocal microscope. Data are representative of (a-c) three and (d,e) two independent experiments.
Extended Data Fig. 7 |
Extended Data Fig. 7 |. Gzmk-deficient mice have reduced swelling and complement activation in the wrists following induction of arthritis.
a, Littermate Gzmk+/− animals have less severe wrist swelling following treatment with mBSA than Gzmk−/− animals. b, Representative entire wrist joint H&E and immunofluorescence images with antibody staining for C3d (magenta), C4d (yellow) and Hoechst nuclear stain (blue) of Gzmk+/+ (top) or Gzmk−/− (bottom) wrist synovium at day 3 post intra-articular mBSA injection. White and yellow boxes depict enlarged images shown in Fig. 5d. ROIs for quantification of C3d and C4d were made by outlining synovium and surrounding inflammation on the Hoechst channel and overlaying a grid before being applied to corresponding C3d and C4d channels. Scale bar represents 500um. (a) Data is mean ± of 7 mice per genotype and are representative of 3 independent experiments with significance calculated by area under the curve analysis. (b) Data are representative of 3 mice per genotype.
Extended Data Fig. 8 |
Extended Data Fig. 8 |. Gzmk-deficient mice have reduced swelling and complement activation in the knees following induction of arthritis.
a, Gzmk+/+ mice have more severe swelling in mBSA-treated knees than Gzmk−/− mice. b, Quantification of C3d and C4d deposition in knee synovium at day 3 post intra-articular mBSA injection. c, Representative enlarged H&E and immunofluorescence images with antibody staining for C3d (magenta), C4d (yellow) and Hoechst nuclear stain (blue) of Gzmk+/+ (top) or Gzmk−/− (bottom) knee synovium at day 3 post intra-articular mBSA injection. Scale bar represents 50um. d, Representative entire knee joint H&E and immunofluorescence images with antibody staining for C3d (magenta), C4d (yellow) and Hoechst nuclear stain (blue) of Gzmk+/+ (top) or Gzmk−/− (bottom) knee synovium at day 3 post intra-articular mBSA injection. White and yellow boxes depict enlarged images shown in (c). ROIs for quantification of C3d and C4d were made by outlining synovium and surrounding inflammation on the Hoechst channel and overlaying a grid before being applied to corresponding C3d and C4d channels. Scale bar represents 500um. (a) Data are mean ± s.e.m of 6 mice per genotype and are representative of two independent experiments.Significance was calculated using area under the curve analysis. (b) Data are the combination of 3 mice per genotype, with the dashed line depicting the median and dotted lines representing the 25th and 75th quartiles. Significance was calculated using a two-way t test with Welch’s correction. (c,d) Data are representative of 3 mice per genotype. ns = not significant.
Extended Data Fig. 9 |
Extended Data Fig. 9 |. Gzmk-deficient mice are protected from IMQ-induced dermatitis and complement activation.
a, Littermate IMQ-treated Gzmk−/− mice have less severe total clinical scores, erythema, scaling, and thickness scores, and decreased thickening of back skin as measured by caliper compared to IMQ-treated Gzmk+/− mice. b, Representative skin H&E and immunofluorescence images with antibody staining for C3d (magenta), C4d (yellow) and Hoechst nuclear stain (blue) of Gzmk+/+ (top) or Gzmk−/− (bottom) after 5 daily applications of IMQ. White and yellow boxes represent enlarged images shown in Fig. 5h. ROIs for quantification of C3d and C4d were made by outlining the skin, overlaying a grid, and selecting squares that contained dermal-epidermal junction based on the Hoechst channel before being applied to corresponding C3d and C4d channels. Scale bars represent 500um. (a) Data shown are mean ± s.e.m. and are representative of 4 independent experiments. Significance was calculated by multiple two-tailed t-tests with a false discovery rate of 5% using the method of Benjamini, Krieger and Yekutiel. (b) Data are representative of 3 mice per genotype.
Extended Data Fig. 10 |
Extended Data Fig. 10 |. GZMK activates the entire complement cascade.
a. Model of GZMK-mediated complement activation. CD8+ T cells constitutively release GZMK independently of TCR stimulation. GZMK binds plasma membranes via interactions with heparan sulfate glycosaminoglycans (HSGAGs), where it cleaves C4 and C2 to generate C4b and C2b. The proximity of newly cleaved C4b to the membrane enables its covalent attachment via an exposed thioester, facilitating the formation of a membrane-bound C3 convertase upon association with C2b. This convertase cleaves C3 into C3a and C3b, with C3b either serving as an opsonin or associating with membrane-bound C3 convertases to form C5 convertases. These C5 convertases cleave C5 into C5a and C5b, the latter initiating the sequential recruitment of C6, C7, C8 and C9 to assemble the terminal complement complex (TCC). b. Comparison between the alternative, classical, lectin and GZMK-mediated complement activation pathways. Activation of the classical and lectin pathways unfolds in three sequential phases: recognition, initiation and execution. Soluble pattern recognition receptors, such as C1q and mannose-binding lectin, spearhead this process by detecting danger signals on target surfaces. This recognition event triggers the activation of initiator proteases, including C1s and MASP1, which cleave C4 and C2 to assemble C3 and C5 convertases. These convertases drive the execution phase, cleaving C3 and C5 to generate the effector molecules of the complement cascade. In contrast to these canonical mechanisms of complement activation, GZMK independently orchestrates both recognition and initiation, bypassing the need for soluble pattern recognition receptors. Through its intrinsic affinity for HSGAGs, GZMK binds directly to target surfaces. Like C1s and MASP1/2, GZMK functions as an initiator protease that cleaves C4 and C2 into C4b and C2b, assembling C3 and C5 convertases that propagate the cascade. This process enables recruitment of the alternative complement pathway, amplifying the response and enhancing its functional impact.
Fig. 1 |
Fig. 1 |. GZMK is expressed by CD8+ T cells, NK cells and innate-like T cells in blood and tissues.
a, Representative flow-cytometry plots showing intracellular GZMK and GZMB staining of subsets of T cells and NK cells in healthy peripheral blood. b, Frequency of GZMK expression by subsets of T cells or NK cells in peripheral blood from healthy controls. c, Among all GZMK+ lymphocytes in blood, the percentage belonging to each T cell or NK cell subset is shown. In b,c, n = 10 for CD4+ T cells; n = 15 for all other populations. d,e, Representative flow-cytometry plots (d) and aggregate data (e) showing the expression of GZMK protein, as measured by intracellular flow cytometry of unstimulated CD4+ or CD8+ T cells from synovial tissue collected from patients with RA (n = 10). f, Representative image showing immunofluorescent staining of RA synovial tissue. Arrowheads indicate examples of GZMK+ T cells. Data are representative of at least three independent experiments. g, Uniform manifold approximation and projection (UMAP) plots displaying single-cell RNA-seq profiles from 94,056 T cells and 8,497 NK cells in synovial tissue from patients with RA (n = 70) or osteoarthritis (n = 9) shaded by expression of the indicated protein marker or gene transcript. h, UMAP plot of Louvain clustering of 85,522 integrated single-cell RNA-seq profiles from T cells and NK cells from healthy or diseased tissues from RA synovium, Crohn’s disease ileum, ulcerative colitis (UC) colon, lupus nephritis (SLE) kidney, and COVID-19 bronchoalveolar lavage fluid (BALF). Expression patterns of selected genes are shown for the integrative dataset in UMAP space. i, Percentage of cells in CD4+ T cell clusters (gray, left) or CD8+ T cell clusters (blue, right) from dataset shown in h with detectable GZMK gene expression, stratified by tissue and disease source. (b,c and e). Data are mean ± s.d.
Fig. 2 |
Fig. 2 |. GZMK cleaves the complement components C4 and C2 to generate a C3 convertase that cleaves C3 into C3a and C3b.
a, Bulk CD8+ T cells were isolated by magnetic-activated cell sorting from the peripheral blood of two donors and left either unstimulated or stimulated with anti-CD3/CD28 dynabeads for 6, 24, or 48 h. The precipitated supernatants and lysates were analyzed by immunoblot using antibodies against GZMK and GZMB. b, Increasing concentrations of active GZMK or GZMA were incubated with serum-purified C4 for 4 h and the cleavage products were analyzed by immunoblot. Active C1s was used as a positive control for C4 cleavage into C4b. Purified C4b was used to confirm the size of the C4b fragment generated by C1s and GZMK. c, Active GZMK was incubated with C2 for 4 h in the presence or absence of increasing concentrations of C4, and cleavage products were analyzed by immunoblot. Active C1s was used as a positive control for C2 cleavage into C2b. d,e, Increasing concentrations of active GZMK or GZMA were incubated with C2 + C3 + C4 and cleavage products were analyzed by immunoblot. Active C1s was used as a positive control for the generation of a C3 convertase that cleaves C3 into C3a (d) and C3b (e). Serum-purified C3a and C3b were used to confirm the identity of the fragments generated by C1s and GZMK, and purified iC3b was used to determine whether GZMK generates inactive C3b. Schematic representations of the assays are shown for b-e. Data are representative of at least four independent experiments. Schematic were made using BioRender with the following publication licenses: https://biorender.com/a20w573 (b), https://biorender.com/w32u944 (c) and https://biorender.com/n80g695 (d).
Fig. 3 |
Fig. 3 |. Synovial fibroblasts are major producers of tissue-derived complement proteins that are substrates for GZMK.
a, Expression of complement C2, C3, C4A and C4B in T cells, B cells, monocytes and fibroblasts sorted from disaggregated synovial tissue from patients with RA (n = 33) or osteoarthritis (n = 12), measured by low-input RNA-seq using data from the AMP RA/SLE network. Data are mean ± s.d.; TPM, transcripts per million reads. b, Representative image showing immunofluorescence staining of RA synovial tissue stained with antibodies against complement C3/C3d (yellow), PDPN (podoplanin; magenta) and Hoechst nuclear stain (blue). Scale bar, 40 μm. c, Synovial fibroblasts were left untreated or stimulated with IFNγ or TNF for 24 h and the supernatants were precipitated and immunoblotted against C2, C3 or C4. Serum-purified C2, C3, C3b, C4 and C4b were run as controls to identify the bands. d, Synovial fibroblasts were left untreated or stimulated with IFNγ, TNF, or IFNγ + TNF for 24 h, and supernatants were assayed for the presence of C2, C3, or C4 by ELISA. Data are mean ± s.d of three technical replicates. e, Synovial fibroblasts were stimulated for 24 h with IFNγ + TNF, after which the cell-free supernatants were left untreated or were incubated with C1s, GZMK or GZMA, and the cleavage products were analyzed by immunoblot for the generation of C3a and C3b. Serum-purified C3a and C3b were used to confirm the identity of the fragments generated by C1s and GZMK. In b-e, data are representative of at least three independent experiments. A schematic representation of the assay is shown for e. The schematic in e was made using BioRender with publication license https://biorender.com/w52t497.
Fig. 4 |
Fig. 4 |. GZMK activates the entire complement cascade.
a, Degranulation of LAD2 mast cells was assessed by flow cytometry as measured by surface LAMP-1 staining. b, GZMK surface binding was measured by flow cytometry on HUVECs, synovial fibroblasts and THP-1 monocytes. c, Surface C3b deposition on HUVECs, measured by flow cytometry. Normal human serum (NHS) was used as a positive control. d, GZMK surface binding (left) and C3b deposition (right) on HUVECs, assessed by flow cytometry. e, GZMK, either pre-bound to the surface of HUVECs or in solution without HUVECs, was incubated with C2 + C3 + C4. The supernatants were analyzed by immunoblot for the generation of C4a, C2a and C3a. f, C5a generation was assessed by ELISA in the supernatants of HUVECs incubated with GZMK and C2 + C3 + C4 + C5. g, Calcium flux was assessed by flow-cytometric analysis of Fluo-5f-labeled C5aR1-expressing Chem-1 cells incubated with the supernatants generated in f. MFI, mean florescence intensity. h, TCC formation was assessed by flow-cytometric analysis of HUVECs incubated with GZMK + C2 − C9. C5b,6–9 was used as a positive control. Histograms depict representative data. i, Surface deposition of C3b (left), C4d (middle) and TCC formation (right) on HUVECs after incubation with C1q-depleted serum and increasing concentrations of GZMK, measured by flow cytometry. Data in a-i are representative of at least 3 independent experiments. P values were calculated using one-way analysis of variance (ANOVA) with Dunnett’s multiple comparisons tests (c and f-i) or two-way ANOVA with Sidak’s multiple comparisons tests (d). NS, not significant. Data are mean ± s.d. of three (c,d,f and h) or five (i) independent experiments, or three technical replicates from a representative of three independent experiments (g). In b, data are representative of three independent experiments.
Fig. 5 |
Fig. 5 |. GZMK drives complement activation and inflammatory disease in mouse models of arthritis and psoriasis.
a, Representative image showing immunofluorescence staining of RA synovial tissue against C3d (yellow, top composite), C5a (yellow, bottom composite) and GZMK (red), as well as Hoechst nuclear stain (blue). Scale bar, 50 um. b, Gzmk−/− mice have less swelling in wrists treated with mBSA (methylated bovine serum albumin) than Gzmk+/+ mice. PBS, phosphate-buffered saline; AUC, area under the curve. c, Quantification of C3d and C4d deposition in wrist synovium at day 3. Graphs show regions of interest from three mice per genotype. Dashed lines represent the median and dotted lines represent the 25th and 75th quartiles. d, Representative haematoxylin and eosin (H&E) and immunofluorescence images of Gzmk+/+ (top) and Gzmk−/− (bottom) against C3d (magenta), C4d (yellow) and Hoechst nuclear stain (blue) in day 3 synovium. Scale bars, 50 um. e-f, Gzmk−/− mice have less severe psoriasiform dermatitis (e) and erythema, scaling and thickness (f) than Gzmk+/+ animals. g, Quantification of C3d and C4d deposition in the dermis at day 5 of IMQ treatment. Graphs show regions of interest from three mice per genotype. Dashed lines represent the median and dotted lines represent the 25th and 75th quartiles. h, Representative H&E and immunofluorescence images of Gzmk+/+ (top) and Gzmk−/− (bottom) against C3d (magenta), C4d (yellow) and Hoechst nuclear stain (blue) at day 5 of IMQ treatment. Scale bar, 50 um. In a, data are representative of three independent experiments. In b, e and f, data are mean ± s.e.m. of six mice per genotype for treatment or, in e and f, three mice per genotype for control and are representative of two independent experiments. In d and h, data are representative of three mice per genotype. P values were calculated by area under the curve analysis (b), two-tailed t-test with Welch’s correction (c, g) and multiple two-sided t-tests with a false discovery rate of 5% using the method of Benjamini, Krieger and Yekutieli (e and f). NS, not significant.

Update of

References

    1. Anthony DA, Andrews DM, Watt SV, Trapani JA & Smyth MJ Functional dissection of the granzyme family: cell death and inflammation. Immunol. Rev. 235, 73–92 (2010). - PubMed
    1. Jonsson AH et al. Granzyme K+ CD8 T cells form a core population in inflamed human tissue. Sci. Transl. Med. 14, eabo0686 (2022). - PMC - PubMed
    1. Ricklin D, Hajishengallis G, Yang K & Lambris JD Complement: a key system for immune surveillance and homeostasis. Nat. Immunol. 11, 785–797 (2010). - PMC - PubMed
    1. Holers VM & Banda NK Complement in the initiation and evolution of rheumatoid arthritis. Front. Immunol. 9, 1057 (2018). - PMC - PubMed
    1. Ricklin D, Reis ES & Lambris JD Complement in disease: a defence system turning offensive. Nat. Rev. Nephrol. 12, 383–401 (2016). - PMC - PubMed

MeSH terms

LinkOut - more resources