. 2025 Feb 6;16(1):1416.
doi: 10.1038/s41467-025-56561-y.

Replication-IDentifier links epigenetic and metabolic pathways to the replication stress response

Affiliations

Replication-IDentifier links epigenetic and metabolic pathways to the replication stress response

Sophie C van der Horst et al. Nat Commun. .

Abstract

Perturbation of DNA replication, for instance by hydroxyurea-dependent dNTP exhaustion, often leads to stalling or collapse of replication forks. This triggers a replication stress response that stabilizes these forks, activates cell cycle checkpoints, and induces expression of DNA damage response genes. While several factors are known to act in this response, the full repertoire of proteins involved remains largely elusive. Here, we develop Replication-IDentifier (Repli-ID), which allows for genome-wide identification of regulators of DNA replication in Saccharomyces cerevisiae. During Repli-ID, the replicative polymerase epsilon (Pol ε) is tracked at a barcoded origin of replication by chromatin immunoprecipitation (ChIP) coupled to next-generation sequencing of the barcode in thousands of hydroxyurea-treated yeast mutants. Using this approach, 423 genes that promote Pol ε binding at replication forks were uncovered, including LGE1 and ROX1. Mechanistically, we show that Lge1 affects replication initiation and/or fork stability by promoting Bre1-dependent H2B mono-ubiquitylation. Rox1 affects replication fork progression by regulating S-phase entry and checkpoint activation, hinging on cellular ceramide levels via transcriptional repression of SUR2. Thus, Repli-ID provides a unique resource for the identification and further characterization of factors and pathways involved in the cellular response to DNA replication perturbation.


Conflict of interest statement

Competing interests: The authors declare no competing interests.

Figures

Fig. 1
Fig. 1. Repli-ID, an approach to identify regulators of replication fork progression/stability.
a Construction of the Repli-ID library. Knockout (KO) libraries of yeast mutants were crossed to a barcoder library of yeast strains using SGA technology. Each strain in the barcoder library contains a KanMX selection gene flanked by a unique 20 bp barcode integrated at the HO locus, which is located adjacent to an origin of replication (ARS404). The cross between the KO libraries and the barcoder library produced yeast strains in which each knockout contains a unique barcode. b The strain containing Myc-tagged Pol ε (Pol2-9xMyc) and the galactose-inducible sld3-38A dbf4-4A construct, which was integrated at the BAR1 locus, was crossed with the barcoder KO library to generate the Repli-ID library. c Outline of the Repli-ID procedure. Strains from the Repli-ID library were pooled and grown in liquid medium. Pools of cells were arrested in G1 using alpha-factor treatment, after which galactose was added to induce the expression of the sld3-38A dbf4-4A mutants, thereby activating all origins during the release into S-phase. The cells were released in S-phase in the presence of 200 mM HU for 40 or 80 min. Next, cells were subjected to chromatin immunoprecipitation (ChIP) of Pol ε-9xMyc using anti-Myc antibody. The barcodes were amplified from ChIP and input DNA. d Next-generation sequencing of barcodes. Barcodes were counted in immunoprecipitated (IP) and input samples. Abundance of Pol ε was measured by adjusting barcode levels in IP to those in the input. This approach enabled the measurement of DNA polymerase levels at the barcode in each individual mutant, allowing for a direct comparison with wild-type levels.
Fig. 2
Fig. 2. Repli-ID identifies known and new regulators of DNA replication fork progression/stability.
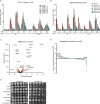
a Outcome of Repli-ID for Pol ε-9xMyc in 2905 yeast mutants (Supplementary Data 1). Scatter plot shows IP/input ratios at 40 and 80 min after G1 arrest and release in 200 mM HU. The mean of n = 2 independent Repli-ID screens is shown. Each dot represents a single mutant strain. Increased (light blue) and decreased factors (light orange), known replication factors (black) and validated factors (red) are highlighted. b GO Slim biological process analysis (false discovery rate (FDR) < 0.05) of the top 423 mutants showing depletion of Pol ε (< −1.25 log2(fold change) for t = 40 min and t = 80 min). Genome frequency is depicted in red and frequency within Repli-ID in blue. c ChIP-qPCR analysis of Pol ε-9xMyc at ARS607 and ARS404 in a selection of yeast mutants from the Repli-ID screens at 40 min after G1 arrest and release in S-phase in 200 mM HU. Data represent the mean relative fold enrichment of Myc signal over beads only signal of n = 2 independent experiments. Values were normalized to a non-replicated region (ARS607 + 14 kb). d ChIP-qPCR analysis of Pol ε-9xMyc in selected hits from the Repli-ID screens, for which the corresponding mutants were generated de novo in the W303 strain background, at the indicated origins 20 min after G1 arrest and release in S-phase in 200 mM HU. Data represent the mean relative fold enrichment + SEM of Myc signal over beads only signal in n = 3 or n = 4 independent experiments. Values were normalized to a non-replicated region (ARS607 + 14 kb). Statistical significance compared to the wild type was calculated using the two-tailed unpaired Student’s t test, assuming unequal variances, *p < 0.05, **p < 0.01. Source data are provided as a Source Data file.
Fig. 3
Fig. 3. Lge1 controls fork progression/stability via H2B ubiquitylation.
a Overview of qPCR amplicons around ARS607 used in ChIP-qPCR experiments. b ChIP-qPCR analysis of Pol ε-13xMyc at ARS607 in the indicated strains at different timepoints after release from G1 in S-phase in 200 mM HU. Data represent the mean relative fold enrichment + SEM of Myc signal over beads only signal of n = 4 independent experiments. Values were normalized to a non-replicated region (ARS607 + 14 kb). c Dynamics of ARS607 duplication assayed by DNA copy number analysis using qPCR in the indicated strains at different timepoints after release from G1 in S-phase in 200 mM HU. Data represent the mean DNA quantity + SEM of n = 3 independent experiments. Values were normalized to a non-replicated region (ARS607 + 14 kb) and further normalized to the ratios of the samples in G1, which were set to 1. d Cell cycle profiling of the indicated strains. Cells were grown, arrested in G1, and released in 10 mM HU. DNA content was determined by propidium iodide (PI) staining and flow cytometry. A repeat of this experiment is shown in Supplementary Fig. 3c. e As in (b), except for Mcm4-3xFLAG. Data represent the mean relative fold enrichment + SEM of FLAG signal over beads only signal of n = 3 independent experiments. Values were normalized to a non-replicated region (ARS607 + 14 kb). f As in (b), except for H2B ubiquitylation at Lysine 123 (H2Bub). Data represent the mean relative fold enrichment + SEM of H2Bub signal over input signal of n = 3 independent experiments. Values were normalized to a telomere region (TELVI-R), 0.5 kb away from the telomere on the right arm of chromosome 6 at which no binding of Bre1 is expected due to a lack of histones. g As in (b), expect for bre1Δ. Statistical significance compared to wt was calculated using the two-tailed unpaired Student’s t test, assuming unequal variances, *p < 0.05, **p < 0.01, ***p < 0.001. Source data are provided as a Source Data file.
Fig. 4
Fig. 4. Lge1 controls the intra-S-checkpoint and fork recovery via H2B ubiquitylation.
a ChIP-qPCR analysis of 3xFLAG-Bre1 at ARS607 and ARS501 in the indicated strains at different timepoints after release from G1 in S-phase in 200 mM HU. Data represent the mean relative fold enrichment + SEM of FLAG signal over beads only signal of n = 3 independent experiments. Values were normalized to a telomere region (TELVI-R). b Representative western blot analysis (n = 2) of Rad53-3xFLAG phosphorylation in the indicated strains at different timepoints after G1 arrest and release in S-phase in 200 mM HU. Dotted line indicates a cropped blot. A repeat of this blot is shown in Supplementary Fig. 4d. c Clonogenic survival of the indicated strains following exposure to 300 mM HU for the indicated time periods. Data represent the mean + SEM of n = 3 independent experiments. d Model showing the role of Bre1-Lge1 in response to replication stress (see text for details). Statistical significance compared to wt was calculated using the two-tailed unpaired Student’s t test, assuming unequal variances, *p < 0.05, **p < 0.01. Source data are provided as a Source Data file.
Fig. 5
Fig. 5. Rox1 controls the response to replication stress by repressing Sur2.
a ChIP-qPCR analysis of Pol ε-13xMyc at ARS607 in the indicated strains at different timepoints after release from G1 arrest in S-phase in 200 mM HU. Data represent the mean relative fold enrichment + SEM of Myc signal over beads only signal in n = 3 independent experiments. Values were normalized to a non-replicated region (ARS607 + 14 kb). Statistical significance compared to wt was calculated using the two-tailed unpaired Student’s t test, assuming unequal variances, *p < 0.05, **p < 0.01. b As in (a), except for Mcm4-3xFLAG. Data represent the mean relative fold enrichment + SEM of FLAG signal over beads only signal of n = 3 independent experiments. Values were normalized to a non-replicated region (ARS607 + 14 kb). c Volcano plot of up- and downregulated genes identified by RNA-seq analysis in rox1Δ compared to wt cells following G1 arrest and release in S-phase in 200 mM HU. Data represent the mean of n = 3 independent experiments. p values were calculated using the Wald test. Notably, for RNR3 and ANB1, the -log10 (p-value) exceeded 250, indicating that the p-value was effectively close to zero d Waterfall plot of colony size changes in a suppressor screen of rox1Δ double mutants grown on YPD plates with and without 300 mM HU. Data represent n = 1 experiment. e Spot dilution assay with the indicated strains which were generated de novo in the W303 background. Fivefold serial dilutions were spotted on medium without or with the indicated concentrations of HU. Source data are provided as a Source Data file.
Fig. 6
Fig. 6. Rox1 affects DNA replication by regulating checkpoint activation and S-phase entry through Sur2/ceramide control.
a Spot dilution assay with the indicated strains. Fivefold serial dilutions were spotted on medium without or with 100 mM HU and/or 15 µM ceramide. b Representative western blot analysis (n = 2) of Rad53-3xFLAG phosphorylation in the indicated strains after G1 arrest and a 60 min release in S-phase in 200 mM HU and/or 15 µM ceramide. Total protein staining by Ponceau is a loading control. A repeat of this blot is shown in Supplementary Fig. 6e. c Budding index analysis of the indicated strains following G1 arrest and release in S-phase in 200 mM HU. Data represent the mean + SEM of n = 3 independent experiments. Statistical significance between rox1Δ compared to wt is shown. d As in (c), except for the indicated strains in 200 mM HU and/or 15 µM ceramide. Data represent the mean + SEM of n = 3 independent experiments. Statistical significance between rox1Δsur2Δ compared to rox1Δsur2Δ + ceramide is shown. e ChIP-qPCR analysis of Pol ε-13xMyc at ARS607 in the indicated strains after G1 arrest and a 20 min release in S-phase in 200 mM HU and/or 15 µM ceramide. Data represent the mean relative fold enrichment + SEM of Myc signal over beads only signal in n = 3 independent experiments. Values were normalized to a non-replicated region (ARS607 + 14 kb). f Model showing the role of Rox1 and Sur2 during the replication stress response (see text for details). Statistical significance compared to wt was calculated using the two-tailed unpaired Student’s t test, assuming unequal variances, *p < 0.05, **p < 0.01, ***p < 0.001. Source data are provided as a Source Data file.

References

    1. Gaillard, H., García-Muse, T. & Aguilera, A. Replication stress and cancer. Nat. Rev. Cancer15, 276–289 (2015). - PubMed
    1. Alani, E., Thresher, R., Griffith, J. D. & Kolodner, R. D. Characterization of DNA-binding and strand-exchange stimulation properties of y-RPA, a yeast single-strand-DNA-binding protein. J. Mol. Biol.227, 54–71 (1992). - PubMed
    1. Wanrooij, P. H., Tannous, E., Kumar, S., Navadgi-Patil, V. M. & Burgers, P. M. Probing the Mec1ATR checkpoint activation mechanism with small peptides*. J. Biol. Chem.291, 393–401 (2016). - PMC - PubMed
    1. Kumar, S. & Burgers, P. M. Lagging strand maturation factor Dna2 is a component of the replication checkpoint initiation machinery. Genes Dev.27, 313–321 (2013). - PMC - PubMed
    1. Katou, Y. et al. S-phase checkpoint proteins Tof1 and Mrc1 form a stable replication-pausing complex. Nature424, 1078–1083 (2003). - PubMed

MeSH terms

LinkOut - more resources