. 2025 Feb 6;16(1):1397.
doi: 10.1038/s41467-024-55424-2.

Distinct immune cell infiltration patterns in pancreatic ductal adenocarcinoma (PDAC) exhibit divergent immune cell selection and immunosuppressive mechanisms

Affiliations

Distinct immune cell infiltration patterns in pancreatic ductal adenocarcinoma (PDAC) exhibit divergent immune cell selection and immunosuppressive mechanisms

Shivan Sivakumar et al. Nat Commun. .

Abstract

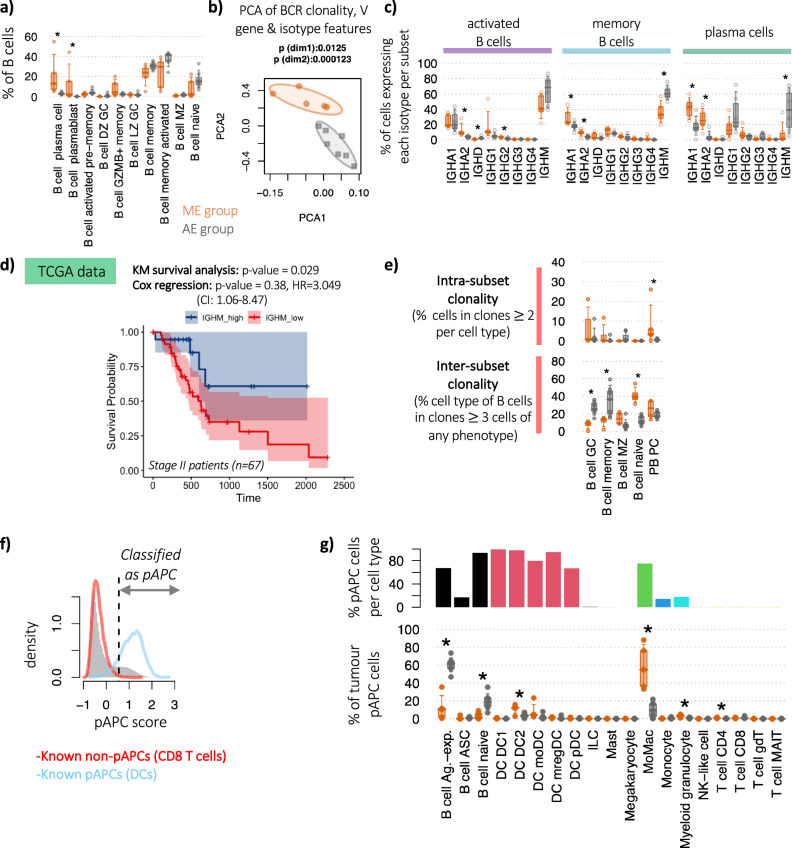
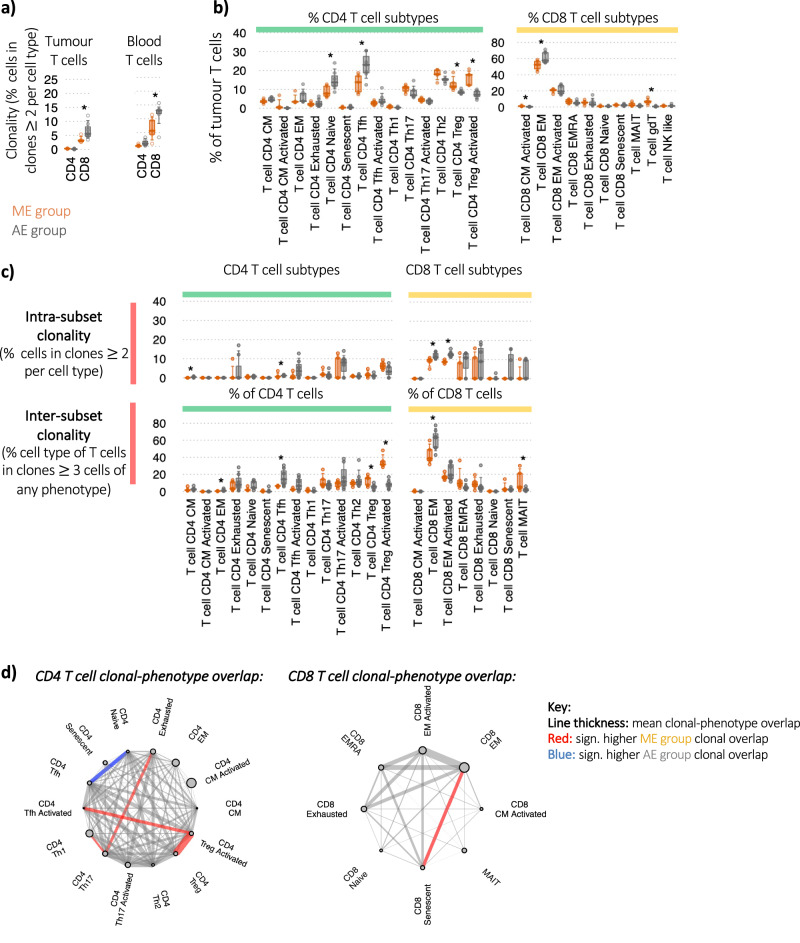
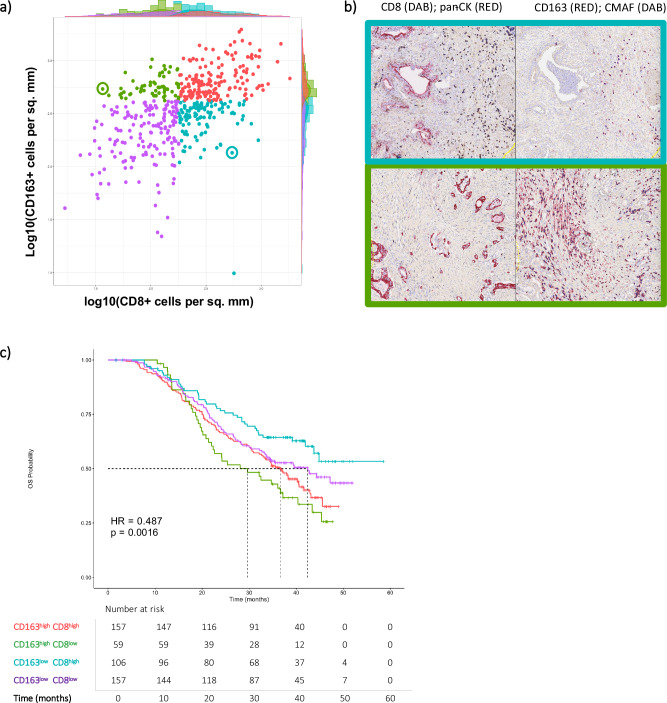
Pancreatic ductal adenocarcinoma has a dismal prognosis. A comprehensive analysis of single-cell multi-omic data from matched tumour-infiltrated CD45+ cells and peripheral blood in 12 patients, and two published datasets, reveals a complex immune infiltrate. Patients have either a myeloid-enriched or adaptive-enriched tumour microenvironment. Adaptive immune cell-enriched is intrinsically linked with highly distinct B and T cell clonal selection, diversification, and differentiation. Using TCR data, we see the largest clonal expansions in CD8 effector memory, senescent cells, and highly activated regulatory T cells which are induced within the tumour from naïve cells. We identify pathways that potentially lead to a suppressive microenvironment, including investigational targets TIGIT/PVR and SIRPA/CD47. Analysis of patients from the APACT clinical trial shows that myeloid enrichment had a shorter overall survival compared to those with adaptive cell enrichment. Strategies for rationale therapeutic development in this disease include boosting of B cell responses, targeting immunosuppressive macrophages, and specific Treg cell depletion approaches.


Conflict of interest statement

Competing interests: S.S. held a personal fellowship from BMS during this study with a grant provided to conduct experiments and also has research funding from Alchemab, has received speaker fees and travel grants from Astrazeneca, Novartis and Servier; and also conducts trials with Astrazeneca, Novartis, Roche, Genentech and BioNTech. E.A.B. is a contributor to intellectual property licensed by Oxford University Innovation to AstraZeneca and held a research award from Guts UK/Dr Falk during this project. D.J.R., M.W., S.C., T.L., P.V.S., and A.V.R. are current or former employees and shareholders of BMS. M.R.M. reports grants from GRAIL, Roche, Astrazeneca, BMS, Infinitopes, Immunocore, and study fees from BMS, Pfizer, MSD, Regeneron, BiolineRx, Replimune and Novartis outside of the submitted work. M.L.D. is on the SAB for Adaptimmune and Singula Bio, consults for Molecular Partners, Enara Bio, Labgenius and Astra Zeneca, and undertakes research supported by BMS, Cue Biopharma, Boehringer Ingelheim, Regeneron and Evolveimmune outside the submitted work. The remaining authors declare no competing interests. R.B.-R. is a co-founder of Alchemab Therapeutics Ltd and consultant for Alchemab Therapeutics Ltd, Roche, Enara Bio, UCB and GSK.

Figures

Fig. 1
Fig. 1. Increased intra-tumoural lymphocyte infiltration is associated with distinct immune cellular compositions.
a Schematic of the datasets and analyses. Created in BioRender. (https://BioRender.com/y83y505). b UMAP dimensionality reduction of the intra-tumoural immune cells from the PancrImmune dataset depicting total immune cells (centre), B cells (left), myeloid cells (bottom) and T cells (right). c The correlation of (left) B cells and Myeloid cells and (right) myeloid cells and T cells as a proportion of total intra-tumoural immune cells across the three datasets, coloured blue, red and yellow for the PancrImmune (n = 12), Peng (n = 24) and Steele (n = 11) datasets respectively. R-values and p values calculated via Pearson linear regression, shaded area denotes 85th percentile confidence intervals. d The cellular proportions of the broad intra-tumoural immune cell types between myeloid- (n = 5) and adaptive-enriched (n = 7) patients in the PancrImmune dataset. e Principal component analysis (PCA) of the intra-tumoural immune cell proportions per sample, coloured orange for myeloid-enriched (ME) patient samples and grey for adaptive immune cell enriched (AE) patient samples (PancrImmune dataset). Ellipses represent the 65th percentile intervals. f Heatmap of the differences in intra-tumoural cellular proportions between ME and AE patient tumour samples. The colour denotes the proportional skew between ME and AE patients. * denotes a significant difference between ME and AE patients (p value < 0.05). Statistical tests were performed by two-sided MANOVA. Boxplots define the 10th, 25th, 50th, 75th and 90th percentiles. Schematic created with BioRender.com.
Fig. 2
Fig. 2. Increased PDAC lymphocyte infiltration is associated with differences in B cell selection, clonal expansion and class-switch recombination.
a Immune cell subset proportions between ME and AE patient groups within tumour B cell subsets as a proportion of total B cells (orange represents ME patients and grey represents AE patients) within the PancrImmune dataset. b Principal component analysis (PCA) of the tumour BCR clonality, IGHV gene usages and isotype usages, coloured by patient group. c The proportions of tumour B cells within activated, memory and plasma cells expressing each isotype, coloured by patient group. d Survival plot for high vs. low IGHM expression with a p value for Kaplan–Meier (KM) plot (log-rank test) and Cox proportional hazards model (two-sided Wald test). HR hazard ratio, CI confidence interval. e Clonality of the tumour B cell subpopulations between the ME and AE patient groups via two measures: (top) intra-subset clonality (the percentage of cells in clones >2 cells per subset, measuring the clonality within the subset thus reflecting specific cell populations which are actively expanding), and (bottom) inter-subset clonality (the percentage of cells of each cell type as members of clones >3 cells across all populations, demonstrating, this indicates cells within each B cell subset that may be members of larger clones than span multiple phenotypes, reflecting B cell plasticity of expanding clones). f Histogram of the professional antigen presentation (pAPC) scores for (grey) all tumour cells, (red) tumour CD8 T cells and (blue) tumour DCs. Dashed line indicates the threshold for classification of pAPCs. g (top) Bar chart of the percentages of pAPCs comprising each cell type, and (bottom) the proportion of tumour pAPCs comprising each cell type between patient groups. All single cell analyses in this figure were performed on the intra-tumoural B cells from PancrImmune dataset. * denotes p values < 0.05, and tests were performed by two-sided MANOVA. ME patients have an n = 5 and AE patients have an n = 7. Boxplots define the 10th, 25th, 50th, 75th and 90th percentiles.
Fig. 3
Fig. 3. Increased PDAC lymphocyte infiltration is associated with increased activated Treg clonality.
a The clonality of intra-tumoural T cells within total CD4 and CD8 T cell populations, measured by percentage of clones consisting of >2 cells. Orange represents ME patients and grey represents AE patients. b Immune cell subset proportions between ME and AE patient groups within tumour T cell subsets as a proportion of total CD4 and CD8 T cells, respectively. c Clonality of the tumour T cell subpopulations between the ME and AE patient groups via two measures: (top) intra-subset clonality (the percentage of cells in clones >2 cells per subset, measuring the clonality within the subset thus reflecting specific cell populations which are actively expanding), and (bottom) inter-subset clonality (the percentage of cells of each cell type as members of clones >3 cells across all populations, demonstrating, this indicates cells within each T cell subset that may be members of larger clones than span multiple phenotypes, reflecting T cell plasticity of expanding clones). d Level of tumour TCR clonal sharing between (left) CD4 T cell and (right) CD8 T cell populations. Each line represents a sharing of TCR clones between cell types, and the line thickness denotes the mean relative level of sharing. A red line denotes that the clonal sharing between the corresponding cell types is significantly higher in the ME patients than AE, and a blue line denotes that the clonal sharing between the corresponding cell types is significantly lower in the ME patients than AE. The size of the dot represents the mean relative frequency of the corresponding cell type. All analyses in this figure were performed on the intra-tumoural B cells from PancrImmune dataset. * denotes p values < 0.05, and tests were performed by two-sided MANOVA. ME patients have an n = 5 and AE patients have an n = 7. Boxplots define the 10th, 25th, 50th, 75th and 90th percentiles.
Fig. 4
Fig. 4. Immunosurveilling and resident B and T cell clones are phenotypically distinct.
a Schematic of clonal definitions: B and T cells clones that are a shared between blood and tumour (recirculating clones), b tumour-only (non-circulating TIL clones) and c blood-only clones. Created in BioRender. (https://BioRender.com/y83y505). b The percentage of tumour B cells, CD4 T cells, and CD8 T cells that (red) have clonal members in the blood or (blue) no clonal members in the blood for the ME patients (top) and AE patients (bottom). c Clonal migration overlap plot, showing the linked phenotypes between blood and tumour B and T cells from shared clones between sites. Line thickness represents the relative means calculated over each patient. Red lines indicate that the corresponding clonal sharing between the corresponding cell types is significantly higher in the ME patients than AE, and a blue line denotes that the clonal sharing between the corresponding cell types is significantly lower in the ME patients than AE. d Heatmap of DGE between blood and tumour biopsy between ME and AE patients per lymphocyte cell type. For each chemokine receptor and for each cell type, the upwards triangle denotes significant elevation of expression in tumour compared to blood and downwards triangle denotes significant reduction of expression in tumour compared to blood. The triangles are coloured orange, grey and blue if the significance is observed in ME patients only, AE patients only or both, respectively. The sizes of the triangles denotes relative mean expression. All analyses in this figure were performed on the PancrImmune dataset using both the blood and tumour samples. * denotes p values < 0.05, and tests were performed by two-sided MANOVA. ME patients have an n = 5 and AE patients have an n = 7. Boxplots define the 10th, 25th, 50th, 75th and 90th percentiles.
Fig. 5
Fig. 5. Distinct regulatory mechanisms between patients with different immune cell infiltration.
a Intercellular immune modulator communication network between intra-tumoural immune cells, where each line thickness corresponds to the mean number of receptor-ligand interactions between the corresponding pair of cell types. A red line denotes that the number of receptor ligand-interactions between the corresponding cell types is significantly higher in the ME patients than AE, and a blue line denotes that the number of receptor ligand-interactions between the corresponding cell types is significantly lower in the ME patients than AE. b Quantification of the number of incoming and outgoing interactions per cell type split by ME and AE patient groups, calculated as a sum of all receptor-ligand pairs identified between all cell types. Bars indicate the means for each patient group, and * denotes p values < 0.05 between groups. c The number of interactions of the top 30 significantly enriched immune modulators in ME patients and all the top 30 significantly enriched cytokines, chemokines and immune-modulators in AE patients (p values < 0.05). d The top 20 ranked interaction strengths between the key tumour Treg receptors (CCR4, CCR8, CXCR4 and CXCR6) and their ligands per cell type, coloured by receptor-ligand interaction type. e Differential checkpoint gene expression between adjacent normal pancreatic tissue and PDAC in both immune and non-immune cell compartments (using the Peng et al. dataset). Red circles indicate significantly higher expression in the tumour and green circles indicate significantly higher expression in the adjacent normal pancreatic tissue. Circle size indicates relative mean gene expression per cell type. f Schematic of the checkpoint expression landscape between healthy and pancreatic tumour tissue. All analyses in this figure were performed on the intra-tumoural immune cells from the PancrImmune dataset unless otherwise indicated. * denotes p values < 0.05, and tests were performed by two-sided MANOVA. For the PancrImmune dataset, ME patients have an n = 5 and AE patients have an n = 7. The Peng et al. data had 11 samples from adjacent normal and 24 samples from PDAC tissue. Boxplots define the 10th, 25th, 50th, 75th and 90th percentiles.
Fig. 6
Fig. 6. Tumours that are CD163+ enriched and CD8+ depleted exhibit shortest overall survival.
a Densities of CD163+ and CD8+ cells as measured via IHC are correlated across patients in the APACT trial. Circled examples are shown in (b) Top: IHC images from an example CD8+ high, CD163+ low sample. Bottom: IHC images from an example CD8+ low, CD163+ high samples. Left are images with CD8+ cells stained in DAB (brown) and pan-CK stained in FastRed. Right are images of aligned sections with CD163+ cells stained in FastRed, and CMAF+ cells stained in DAB (brown). c Kaplan–Meier curves shown for the four patient groups defined in (a).

References

    1. Siegel, R. L., Miller, K. D., Wagle, N. S. & Jemal, A. Cancer statistics, 2023. CA Cancer J. Clin.73, 17–48 (2023). - PubMed
    1. O’Reilly, E. M. et al. Durvalumab with or without tremelimumab for patients with metastatic pancreatic ductal adenocarcinoma: a phase 2 randomized clinical trial. JAMA Oncol.5, 1431–1438 (2019). - PMC - PubMed
    1. Bockorny, B. et al. BL-8040, a CXCR4 antagonist, in combination with pembrolizumab and chemotherapy for pancreatic cancer: the COMBAT trial. Nat. Med.26, 878–885 (2020). - PubMed
    1. Biasci, D. et al. CXCR4 inhibition in human pancreatic and colorectal cancers induces an integrated immune response. Proc. Natl Acad. Sci. USA117, 28960–28970 (2020). - PMC - PubMed
    1. Padron, L. J. et al. Sotigalimab and/or nivolumab with chemotherapy in first-line metastatic pancreatic cancer: clinical and immunologic analyses from the randomized phase 2 PRINCE trial. Nat. Med.28, 1167–1177 (2022). - PMC - PubMed

MeSH terms