. 2025 Feb 6;16(1):1407.
doi: 10.1038/s41467-025-56720-1.

Endothelial SHANK3 regulates tight junctions in the neonatal mouse blood-brain barrier through β-Catenin signaling

Affiliations

Endothelial SHANK3 regulates tight junctions in the neonatal mouse blood-brain barrier through β-Catenin signaling

Yong-Eun Kim et al. Nat Commun. .

Abstract

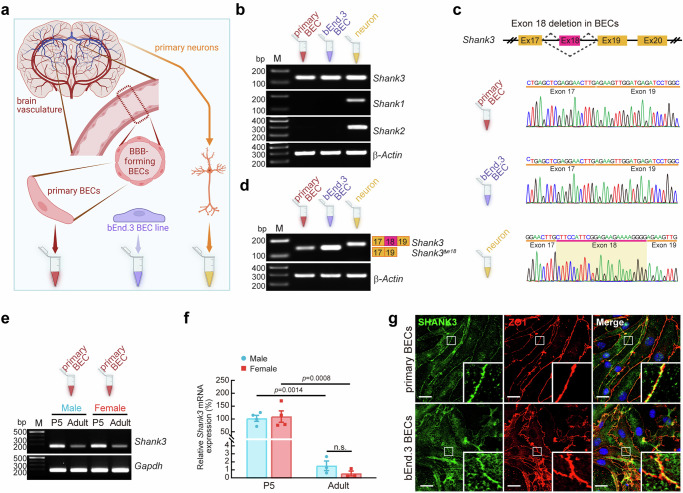
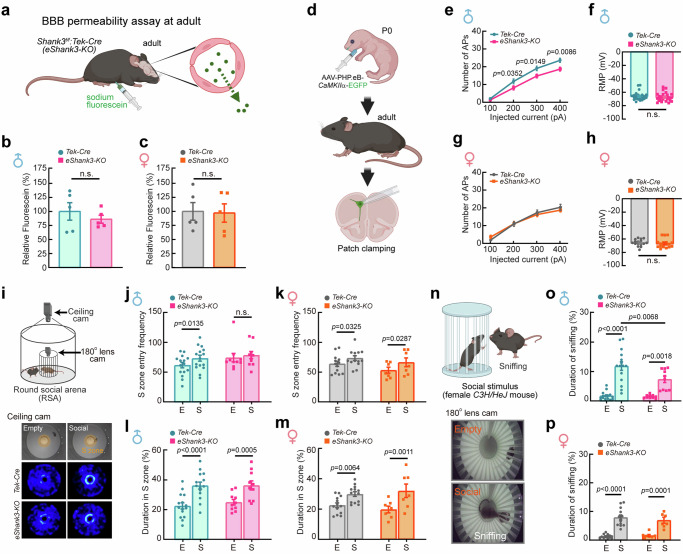
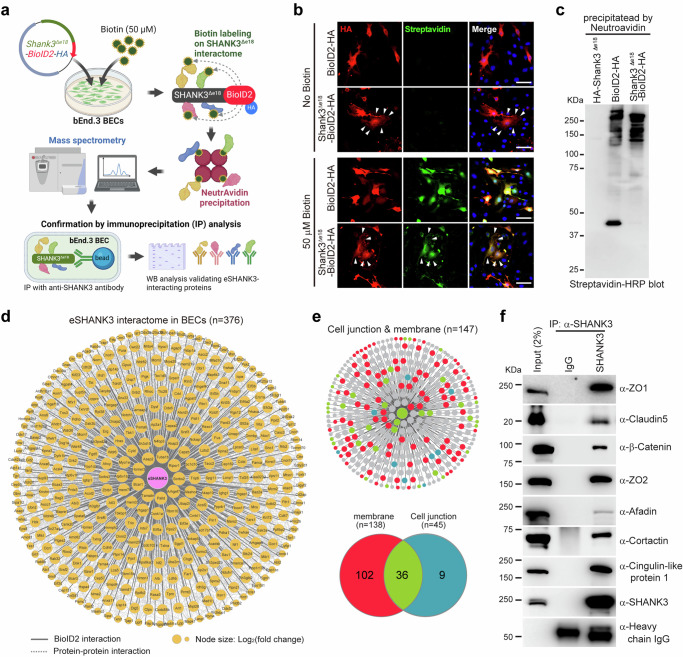
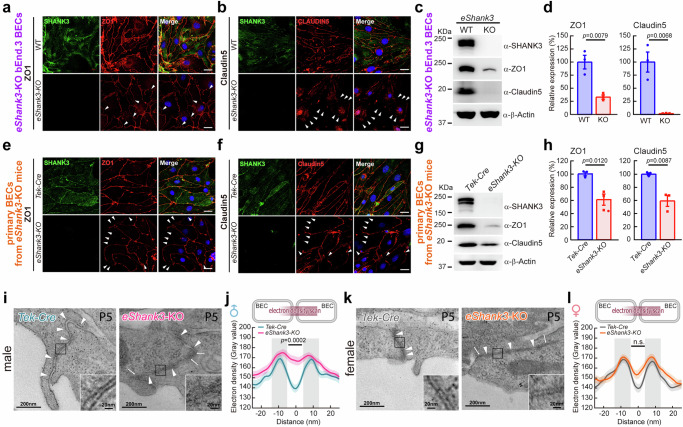
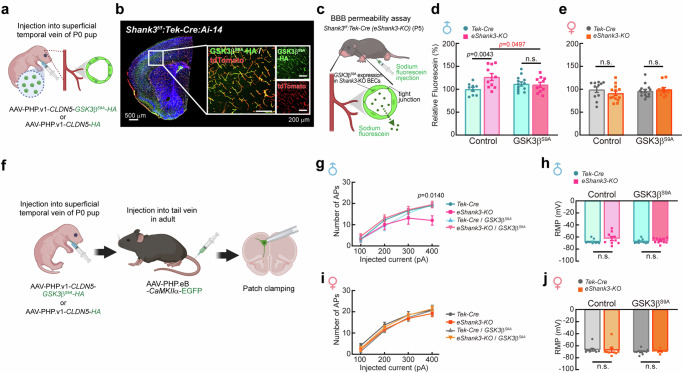
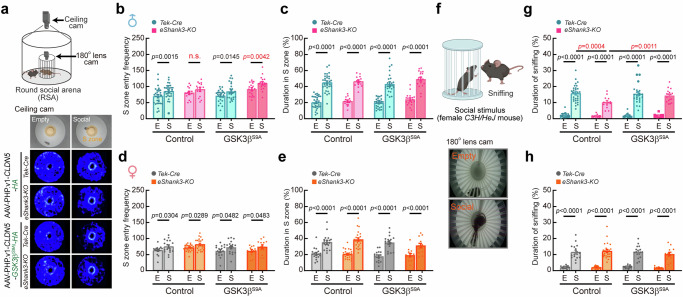
Autism spectrum disorder (ASD) is a neurodevelopmental disability condition arising from a combination of genetic and environmental factors. Despite the blood-brain barrier (BBB) serving as a crucial gatekeeper, conveying environmental influences into the brain parenchyma, the contributions of BBB in ASD pathogenesis remain largely uncharted. Here we report that SHANK3, an ASD-risk gene, expresses in the BBB-forming brain endothelial cells (BECs) and regulates tight junctional (TJ) integrity essential for BBB's barrier function. Endothelium-specific Shank3 (eShank3) knockout (KO) neonatal mice exhibit male-specific BBB-hyperpermeability, reduced neuronal excitability, and impaired ultra-sonic communications. Although BBB permeability is restored during adult age, the male mutant mice display reduced neuronal excitability and impaired sociability. Further analysis reveals that the BBB-hyperpermeability is attributed to the β-Catenin imbalance triggered by eShank3-KO. These findings highlight a pathogenic mechanism stemming from the ASD-risk Shank3, emphasizing the significance of neonatal BECs in the BBB as a potential therapeutic target for ASD.


Conflict of interest statement

Competing interests: The authors declare no competing interests.

Figures

Fig. 1
Fig. 1. A novel Shank3 variant is expressed in BECs.
a Collection of cDNAs from RNA extracts of mouse primary BECs, bEnd.3 BECs, and primary neurons. Created in BioRender. Kim, S. (2025) https://BioRender.com/q10o614. b PCR analysis revealed that mouse primary BECs and bEnd.3 BECs express only Shank3 mRNA, while neurons express all Shank family. β-Actin: input control. Created in BioRender. Kim, S. (2025) https://BioRender.com/c22u541. c Sequencing chromatograms showing the lack of exon 18 in Shank3 mRNA in mouse primary BECs and bEnd.3 BECs, whereas neuronal Shank3 has exon 18. d PCR analysis confirmed exon 18-deleted Shank3 in the mouse primary BECs and bEnd.3 BECs. Shank3Δe18: exon 18 deletion form of Shank3. PCR (e) and qRT-PCR (f) analyses demonstrated that neonatal Shank3 mRNA expression at P5 (n = 4) was significantly higher than that in adult mice (n = 3), in both males and females. The graph represents the relative expression of Shank3 mRNA normalized to its levels in P5 male mice. Gapdh (Glyceraldehyde-3-phosphate dehydrogenase): input control. g ICC analysis revealed that eSHANK3 is mainly expressed in ZO1-positive cell-cell junctional area of mouse primary BECs and bEnd.3 BECs. Insets showing magnified views of the junctional areas. DAPI: nuclear staining. Scale bar, 20 μm. Each experiment b, d, g was independently repeated three times, yielding similar results. Data are mean ± SEM. Statistical analysis was performed using two-way ANOVA followed by Šídák’s multiple comparisons test (f). Detailed statistical methods and results are described in Supplementary Table 1. Source data are provided as Source Data File.
Fig. 2
Fig. 2. Endothelial SHANK3 deficiency leads to defects in BBB permeability, neuronal function, and ultrasonic communication in neonatal mice.
a Schematic illustration of BBB permeability assay at P5. Created in BioRender. Kim, S. (2025) https://BioRender.com/g37y692. Relative amount of sodium fluorescein leaked into brain parenchyma of male (b) and female (c) Tek-Cre control (n = 17 for male, n = 16 for female) and eShank3-KO (n = 12 for male, n = 14 for female) mice at P5. d Strategy to label the neonatal pyramidal neurons with high probability of being impacted by BBB dysfunction. AAV-PHP.eB-CaMKIIα-EGFP injected into the STV of a P0 pup marked PFC neurons adjacent to CD31-positive endothelium at P5. Created in BioRender. Kim, S. (2025) https://BioRender.com/b65v147. e Current-clamp recordings of GFP-positive mPFC pyramidal neurons in the prelimbic region at P5. Analysis of neuronal excitability in mPFC of eShank3-KO male (fh) and female (ik) at P5. Representative traces of APs responded to 100, 200, 300 and 400 pA current injections, respectively (f, i). Graphs represent the number of evoked APs at the indicated current injection (g, j) and the RMP (h, k) in eShank3-KO (n = 14 for male, n = 10 for female from 3 mice per group) and Tek-Cre control (n = 14 for male, n = 8 for female from 3 mice per group) groups. lp Ultrasonic communication testing at P5. l Spectrograms show representative USVs emitted by P5 male eShank3-KO and Tek-Cre control pups separated from their dams. Graphs show the number of USVs calls per min (m, o) and mean call duration (n, p) from male (m-n) and female (o, p) eShank3-KO (n = 10 for male, n = 7 for female) and Tek-Cre control (n = 13 for male, n = 13 for female) pups. Created in BioRender. Kim, S. (2025) https://BioRender.com/v30v894. Data are mean ± SEM. Statistical analysis was performed using two-tailed unpaired t-tests (b, c, h, kp) and two-way ANOVA with repeated measures followed by two-stage linear step-up procedure of Benjamini, Kreiger and Yekutieli (false discovery rate) (g, j). Detailed statistical methods and results are described in Supplementary Table 1. Source data are provided as Source Data File.
Fig. 3
Fig. 3. Persistent effects of eSHANK3 deficiency on neuronal function and social behavior in adult mice.
a Schematic illustration of BBB permeability assay at adult (17–19 week-old). Created in BioRender. Kim, S. (2025) https://BioRender.com/g37y692. Relative amount of NaF leaked into brain parenchyma of male (b) and female (c) Tek-Cre control and eShank3-KO (n = 5 per group) mice. d Labeling of the pyramidal neurons with high probability of being affected by neonatal BBB dysfunction by AAV-PHP.eB-CaMKIIa-EGFP injection into the STV at P0. Patch clamp analyses for the GFP-labeled mPFC neurons were conducted at adult age (17–19 week-old). Created in BioRender. Kim, S. (2025) https://BioRender.com/b65v147. eh Analysis of neuronal excitability in the mPFC of adult male (e) and female (g) eShank3-KO and Tek-Cre control mice. Graphs represent the number of evoked APs at the indicated current injection (e, g) and the RMP (f, h) in male and female eShank3-KO (n = 25 for male, n = 18 for female from 5 mice) and Tek-Cre control (n = 24 for male from 5 mice, n = 16 for female from 4 mice) mice. ip Sociability testing at adult age (17-19 week-old) using RSA assay. i A representative heatmaps show the movement traces of eShank3-KO and Tek-Cre control mice. Graphs display the S zone (3 cm radius from the inner cage) entry frequency (j, k), total duration spent in S zone (l, m) of male and female eShank3-KO (n = 10 for male, n = 7 for female) and Tek-Cre control (n = 15 for male, n = 13 for female) mice. n Representative snapshots of sniffing behavior captured by a 180° fish-eye camera installed in the inner cage. Total duration of sniffing behaviors of male (o) and female (p) eShank3-KO and Tek-Cre control mice. Created in BioRender. Kim, S. (2025) https://BioRender.com/v30v894. Data are mean ± SEM. Statistical analysis was performed using two-tailed unpaired t-tests (b, c, f, h, kp), two-way ANOVA with repeated measures followed by two-stage linear step-up procedure of Benjamini, Kreiger and Yekutieli (false discovery rate) (e, g), and two-way ANOVA followed by Šídák’s multiple comparisons test (jp). Detailed statistical methods and results are described in Supplementary Table 1. Source data are provided as Source Data File.
Fig. 4
Fig. 4. TJ and membrane proteins are major eSHANK3 interactome in BECs.
a Workflow of BioID2 approach illustrating biotinylation of eSHANK3-interacting proteins, purification of the biotinylated proteins by NeutrAvidin agarose beads, mass spectrometry analysis, and validation through IP analysis. Created in BioRender. Kim, S. (2025) https://BioRender.com/q75n212. b ICC analysis using anti-HA antibody and Alexa Fluor® 488-Streptavidin shows colocalization of eSHANK3-BioID2-HA (or BioID2-HA) and biotin labeled proteins only in the biotin-treated bEnd.3 BECs. Arrowheads indicate the co-expression of SHANK3Δe18-BioID2 and biotinylated proteins in the cell membrane. Scale bars, 50 μm. Blue: DAPI. c Streptavidin blot analysis, using purified biotinylated proteins, showed the protein bands of various sizes that were biotinylated by BioID2-HA or Shank3Δe18-BioID2-HA. Four biological replicates were analyzed, all yielding consistent results. 5% of purified proteins were loaded for the blotting analysis. 95% of purified proteins were used for subsequent mass spectrometry analysis. d Mass spectrometry analysis identified 376 candidate eSHANK3 interacting proteins. Node size represents protein abundance [log2 (fold change)] over eSHANK3Δe18-only (no BioID2) and BioID2-only control groups. Solid gray edges delineate interactions between the eSHANK3 and the identified interactome. Dashed edges indicate known interactions. e GO analysis revealed membrane and junctional proteins are the primary eSHANK3 interactome in the bEnd.3 BECs. f IP analysis confirmed the interactions between endogenous eSHANK3 and some of the identified interactome in the bEnd.3 BECs. Three times independent experiments yielded similar results. IgG: control for non-specific antibody binding. Heavy chain IgG: loading control. The detailed information of the identified eSHANK3 interactome and GO analysis are provided in Supplementary Data 1. Source data are provided as Source Data File.
Fig. 5
Fig. 5. eSHANK3 depletion leads to aberrant ZO1/Claudin5 expressions and structural abnormalities in the junctions between BECs.
ah eShank3 deletion effects on ZO1 and Claudin5 in BECs. ICC analysis showed discontinuous and patched (arrowheads) expressions of ZO1 and Claudin5 in both eShank3-KO bEnd.3 BEC line (a, b) and primary BECs from eShank3-KO mice (e, f) compared to controls. Blue: DAPI. Scale bars, 20 μm. WB analysis showing reduced expressions of ZO1 and Claudin5 in the eShank3-KO bEnd.3 BEC line (c, d) and primary BECs from eShank3-KO mice (g, h) compared to WT controls (n = 3 per group). Band intensities were normalized with β-Actin. il Ultrastructure of junctional area between BECs in the PFC. Representative electron micrographs of BEC junctions observed in the brain capillaries of P5 male (i) and female (k) eShank3-KO mice and control Tek-Cre mice (n = 3 mice per group). Arrowheads indicate cell-cell junctions along the adjacent BECs. Arrows indicate abnormal high electron densities in the cleft between BEC membranes. Insets are magnified views of the junctional areas. j Electron density scanning across the junction between BECs revealed elevated electron densities in the cleft of P5 male eShank3-KO mice. l However, this phenotype was not significant in female group. Data are mean ± SEM. Statistical analysis was performed using two-tailed unpaired t-tests (d, h) and mixed-effects analysis followed by Šídák’s multiple comparisons test (j, l). Detailed statistical methods and results are described in Supplementary Table 1. Source data are provided as Source Data File.
Fig. 6
Fig. 6. eSHANK3 regulates the TJ integrity and barrier function via β-Catenin destruction pathway.
a Co-IP analysis showing the interaction between eSHANK3 (HA-SHANK3Δe18) and β-Catenin destruction complex including β-CateninS33Y-FLAG, V5-CK1α, and GSK3β-Myc. β-Actin: loading control. b Subcellular fractionation followed by WB analysis using eShank3-KO and WT bEnd.3 BECs (n = 3). c Phospho-β-CateninS552 in nucleus and cytoplasm were increased in bEnd.3 BECs by eShank3 disruption. α-Tubulin: cytoplasmic marker. Histone H3: nuclear marker. d Hypothetical model illustrating enhanced nuclear translocation of β-CateninS552 by eSHANK3 depletion in BECs. Created in BioRender. Kim, S. (2025) https://BioRender.com/l10t237. ej, IWR-1-endo (1 μM) effects on eShank3-KO BECs. e WB analysis with IWR-1-endo-treated fractionated eShank3-KO bEnd.3 BECs. f Enhanced phospho-β-CateninS552 level was normalized upon IWR-1-endo treatment in cytoplasm and nucleus (n = 3). g WB analysis for ZO1 and Cladudin5 levels in eShank3-KO bEnd.3 BECs following IWR-1-endo treatment. h Reduced ZO1 and Cladudin5 in eShank3-KO bEnd.3 BECs were restored by IWR-1-endo treatment (n = 3). TWP (n = 4) (i) and TEER (n = 12) (j) assays revealed that IWR-1-endo treatment rescues hyperpermeability of eShank3-KO bEnd.3 BECs. Arrow: time point of IWR-1-endo treatment. Bar graph (j; right panel) showed impedance at 95 h time point. kp GSK3β activation effects on eShank3-KO bEnd.3 BECs. k WB analysis measuring total β-Catenin and phospho-β-CateninS552 levels in GSK3β S9A/eShank3-KO double mutant bEnd.3 BECs. l The increased β-CateninS552 level in eShank3-KO bEnd.3 BECs was normalized by GSK3βS9A overexpression both in cytoplasm and nucleus (n = 3). m WB analysis for ZO1 and Claudin5 levels in GSK3βS9A/eShank3-KO bEnd.3 BECs. The HA band showed the overexpression of GSK3βS9A in double mutant bEnd.3 BECs. n The reduced expressions of ZO1 and Claudin5 by eSHANK3 depletion were significantly restored by GSK3βS9A overexpression (n = 3). TWP (n = 4) (o) and TEER (n = 12) (p) assays revealed that GSK3βS9A overexpression rescues hyperpermeability of eShank3-KO bEnd.3 BECs. Bar graph (p; right panel) showed impedance at 95 h time point. Data are mean ± SEM. Statistical analysis was performed using a two-tailed unpaired t-test (c) and one-way ANOVA followed by Dunnett’s multiple comparisons test (f, hj, l, np). Detailed statistical methods and results are described in Supplementary Table 1. Source data are provided as Source Data File.
Fig. 7
Fig. 7. Restoration of neonatal BBB function through GSK3β activation in BECs normalizes neurological function in adult mice.
ae GSK3βS9A overexpression effect on the BBB permeability in vivo. a Injection of AAV-PHP.v1-CLDN5-GSK3βS9A-HA through STV at P0. b IHC analysis using Shank3f/f:Tek-Cre:Ai-14 triple mutant mice shows specific expression of GSK3βS9A-HA (green) in the tdTomato-positive BECs of P5 brain. c Schematic illustration of BBB permeability assay using AAV-PHP.v1-CLDN5-GSK3βS9A-HA-injected eShank3-KO mice at P5. In vivo BBB permeability was assessed with P5 male (d) and female (e) eShank3-KO and control Tek-Cre mice injected by AAV-PHP.v1-CLDN5-GSK3βS9A-HA (n = 10 for male eShank3-KO, n = 13 for male Tek-Cre, n = 11 for female eShank3-KO, n = 14 for female Tek-Cre) or control AAV-PHP.v1-CLDN5-HA (n = 10 for male eShank3-KO, n = 9 for male Tek-Cre, n = 13 for female eShank3-KO, n = 11 for female Tek-Cre) at P0. The increased BBB permeability in male eShank3-KO pups was normalized by overexpression of GSK3βS9A in the BECs. Created in BioRender. Kim, S. (2025) https://BioRender.com/z54o523. f GSK3βS9A overexpression effect on the neuronal excitability. AAV-PHP.v1-CLDN5-GSK3βS9A-HA or control AAV-PHP.v1-CLDN5-HA) was injected into STV at P0 to express GSK3βS9A in the BECs from the neonatal period. To label the excitatory neurons, AAV-PHP.eB-CaMKIIα-EGFP was injected into the tail vein of adult mice (13–15 weeks old). Patch clamp analysis was then performed on GFP-labeled mPFC neurons of 17–19 week-old mice. Created in BioRender. Kim, S. (2025) https://BioRender.com/r42u905. gj Analysis of neuronal excitability in adult male (n = 9 for eShank3-KO with HA expression, n = 11 for Tek-Cre with HA expression, n = 10 for eShank3-KO with GSK3βS9A expression, n = 9 for Tek-Cre with GSK3βS9A expression) (g) and female (n = 9 for each group) (i) eShank3-KO and Tek-Cre control mice, with or without GSK3βS9A expression in BECs. Graphs represent the number of evoked APs at the indicated current injection (g, i) and the RMP (h, j) of each group of mice. Data are mean ± SEM. Statistical analysis was performed using two-way ANOVA followed by Šídák’s multiple comparisons tests (d, e, h, j) and two-way ANOVA with repeated measures followed by two-stage linear step-up procedure of Benjamini, Kreiger and Yekutieli (false discovery rate) (g, i). Detailed statistical methods and results are described in Supplementary Table 1. Source data are provided as Source Data File.
Fig. 8
Fig. 8. Restoration of neonatal BBB function through GSK3β activation in BECs normalizes social behavior in adult mice.
ah Social behavioral tests at adult age (17-19 week-old) using RSA assay. a A representative heatmaps show the movement traces of male eShank3-KO and Tek-Cre control mice injected with AAV-PHP.v1-CLDN5-GSK3βS9A-HA or AAV-PHP.v1-CLDN5-HA. Graphs display the S zone (3 cm radius from the inner cage) entry frequency (b, d), total duration spent in S zone (c, e) of all groups of mice. f Representative snapshots of sniffing behavior captured by a 180° fish-eye camera installed in the inner cage. Total duration of sniffing behaviors of male (g) and female (h) eShank3-KO and Tek-Cre control mice injected with AAV-PHP.v1-CLDN5-GSK3βS9A-HA (n = 17 for male eShank3-KO, n = 24 for male Tek-Cre, n = 13 for female eShank3-KO, n = 17 for female Tek-Cre) or AAV-PHP.v1-CLDN5-HA (n = 13 for male eShank3-KO, n = 29 for male Tek-Cre, n = 24 for female eShank3-KO, n = 17 for female Tek-Cre). Created in BioRender. Kim, S. (2025) https://BioRender.com/v30v894. Data are mean ± SEM. Statistical analyses were performed using two-way ANOVA followed by Šídák’s multiple comparisons tests (be, g, h). Detailed statistical methods and results are described in Supplementary Table 1. Source data are provided as Source Data File.

References

    1. Chaste, P. & Leboyer, M. Autism risk factors: genes, environment, and gene-environment interactions. Dialogues Clin. Neurosci.14, 281–292 (2012). - PMC - PubMed
    1. Obermeier, B., Daneman, R. & Ransohoff, R. M. Development, maintenance and disruption of the blood-brain barrier. Nat. Med.19, 1584–1596 (2013). - PMC - PubMed
    1. Huber, J. D., Egleton, R. D. & Davis, T. P. Molecular physiology and pathophysiology of tight junctions in the blood-brain barrier. Trends Neurosci.24, 719–725 (2001). - PubMed
    1. Ouellette, J. et al. Vascular contributions to 16p11.2 deletion autism syndrome modeled in mice. Nat. Neurosci.23, 1090–1101 (2020). - PubMed
    1. Tarlungeanu, D. C. et al. Impaired amino acid transport at the blood brain barrier is a cause of autism spectrum disorder. Cell167, 1481–1494.e1418 (2016). - PMC - PubMed

MeSH terms

LinkOut - more resources