. 2025 Feb 6;8(1):87.
doi: 10.1038/s41746-024-01426-9.

Predicting appropriateness of antibiotic treatment among ICU patients with hospital-acquired infection

Affiliations

Predicting appropriateness of antibiotic treatment among ICU patients with hospital-acquired infection

Ella Goldschmidt et al. NPJ Digit Med. .

Abstract

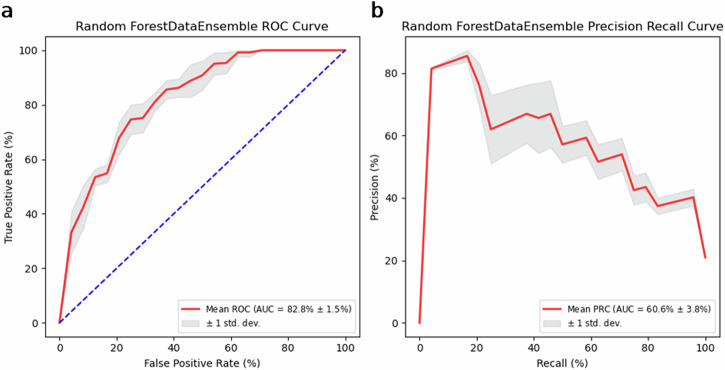
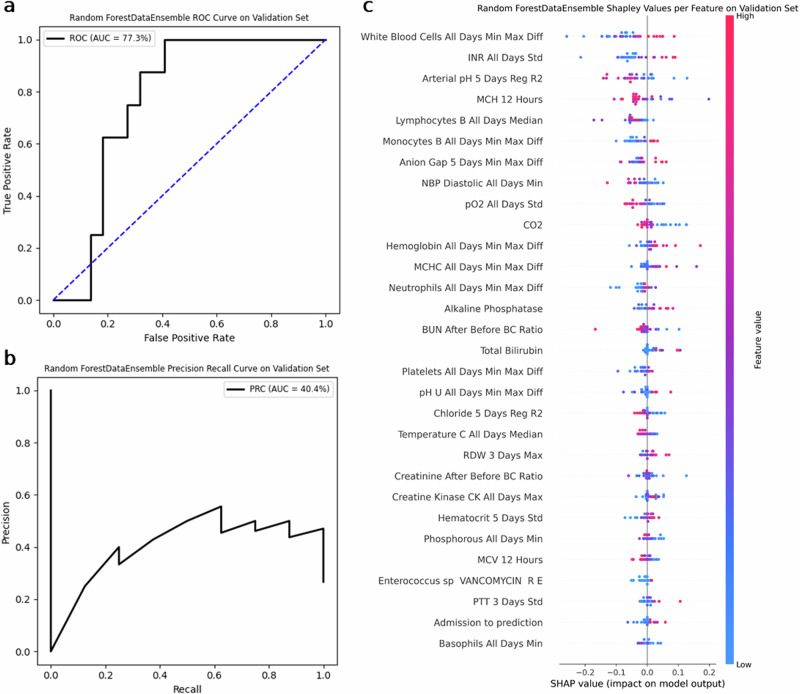
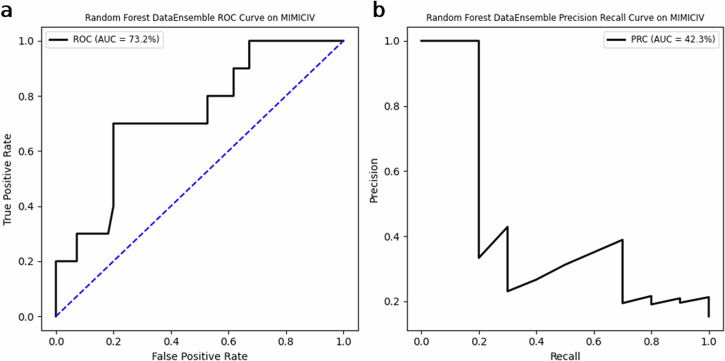
Antimicrobial resistance is a rising global health threat, leading to ineffective treatments, increased mortality and rising healthcare costs. In ICUs, inappropriate empiric antibiotic therapy is often given due to treatment urgency, causing poor outcomes. This study developed a machine learning model to predict the appropriateness of empiric antibiotics for ICU-acquired bloodstream infections, using data from the MIMIC-III database. To address missing values and dataset imbalances, novel computational methods were introduced. The model achieved an AUROC of 77.3% and AUPRC of 40.4% on validation, with similar results on external datasets from MIMIC-IV and Rambam Hospital. The model also predicted mortality risk, identifying a 30% mortality rate in high-risk patients versus 16.8% in low-risk groups. External validation on the eICU database showed a comparable gap, with mortality rates at 24% for high-risk and 7.7% for low-risk groups. Our study demonstrates the potential of machine learning models to predict inappropriate empiric antibiotic treatment.


Conflict of interest statement

Competing interests: The authors declare no competing interests.

Figures

Fig. 1
Fig. 1. Prediction timeline and the model pipeline.
a General timeline of culture results and empirical antibiotic treatment in ICU. After an infection diagnosis is available, a blood culture is taken (BCT), and then the empirical antibiotic (ABX) treatment starts. Gram staining results are available 24 h after the blood culture is taken (pink interval). Organism identification requires an extra 24 h (green interval), and the antibiogram culture results take an additional 24 h to be processed and returned from the laboratory (yellow interval). b, c Patients meeting either one of the following criteria were included in the cohort: b At least 48 h passed from ICU admission until the first BCT (orange interval). c At least 24 h passed from hospital admission to BCT (light blue interval). Our model uses the data collected until 24 h after BCT and then returns the prediction whether the ABX administered was appropriate or not. At that point (marked in blue), the prediction gives the physician the opportunity to reassess the ABX therapy and modify it if needed, 48 h earlier than the antibiogram results.
Fig. 2
Fig. 2. Performance of eight prediction models on the training set.
Performance of eight machine learning models with and without the ‘DataEnsemble’ balancing approach for predicting antibiotic appropriateness. Model performance was evaluated using five iterations of 5-fold cross-validation over the training set. The horizontal line indicates the median, the white circle indicates the mean, the box indicates the IQR, the boundaries of the whiskers are the minimum and maximum values, and the black points indicate outliers. a AUPRC. b AUROC. The models are sorted by the mean AUPRC and AUROC.
Fig. 3
Fig. 3. Mean performance of the Random Forest DataEnsemble model on five iterations of 5-fold cross-validation.
a AUROC. b AUPRC. The red line is the mean, the gray area is ± one standard deviation from the mean.
Fig. 4
Fig. 4. Performance of the Random Forest DataEnsemble model on the validation set.
a AUROC, b AUPRC. c The thirty features with the highest absolute SHAP values. For each feature, the X-axis is the SHAP value, representing the contribution of that value to the model’s decision. The features are ordered in descending mean absolute SHAP values. Each point corresponds to an observation where the color represents the feature value from blue (low value) to red (high value). The sign of the SHAP value indicates whether the feature observation contributes to positive or negative classification. All Days—timeframe of the entire hospitalization up to the prediction time (PT), 3/5 Days—timeframe of 3 or 5 days before PT, 12 h—measurement recorded approximately 12 h prior to PT, Min—minimal value, Max—maximal value, Min Max Diff—difference between the maximal and minimal values measured, Std—standard deviation, Reg R2—R2 coefficient of a linear regression model fitted on values in the timeframe, After Before BC Ratio—ratio between the first value recorded after the blood culture was taken and the last value recorded before it, R—resistant culture, E—existence.
Fig. 5
Fig. 5. Performance of the Random Forest DataEnsemble model on the temporal validation set from MIMIC-IV.
a AUROC, b AUPRC.
Fig. 6
Fig. 6. Performance of the Random Forest DataEnsemble model trained and evaluated on the RHCC cohort.
a AUROC, b AUPRC.
Fig. 7
Fig. 7. Model pipeline.
The steps included in the model pipeline presented in this study. Existence features are binary (e.g., existence of a culture resistant to penicillin); Count features are numerical and ordinal (e.g., number of antibiotic drugs administered to the patient). PT prediction time.
Fig. 8
Fig. 8. Illustration of the imputation scheme for time-series features.
An example of existing feature values for a patient with missing data in the 3-day timeframe (yellow), the values of max, median, min, and at 12 h before prediction time are imputed using linear regression calculated based on existing values (black dots) in the 2 days before the beginning of the timeframe (light blue).
Fig. 9
Fig. 9. Illustration of the “DataEnsemble” model.
On the left is the original dataset, rows of inpatients who received an appropriate antibiotic treatment (negatives) are colored in shades of green, and rows of inpatients who had received inappropriate treatment (positives) are colored in red. On the right are two subsets of the data, each containing all the positive patients, and a random, disjoint subset of the negative patients. The “DataEnsemble” is composed of identical models, each trained on a different subset of the data.

References

    1. Bell, B. G., Schellevis, F., Stobberingh, E., Goossens, H. & Pringle, M. A systematic review and meta-analysis of the effects of antibiotic consumption on antibiotic resistance. BMC Infect. Dis.14, 13 (2014). - PMC - PubMed
    1. Wall, S. Prevention of antibiotic resistance—an epidemiological scoping review to identify research categories and knowledge gaps. Glob. Health Action12, 1756191 (2019). - PMC - PubMed
    1. Laxminarayan, R. et al. Antibiotic resistance—the need for global solutions. Lancet Infect. Dis.13, 1057–1098 (2013). - PubMed
    1. Nathan, C. & Cars, O. Antibiotic resistance—problems, progress, and prospects. N. Engl. J. Med.371, 1761–1763 (2014). - PubMed
    1. Aslam, B. et al. Antibiotic resistance: a rundown of a global crisis. Infect. Drug Resist.11, 1645–1658 (2018). - PMC - PubMed

LinkOut - more resources