. 2025 Feb 6;5(1):38.
doi: 10.1038/s43856-024-00722-5.

Swarm learning with weak supervision enables automatic breast cancer detection in magnetic resonance imaging

Affiliations

Swarm learning with weak supervision enables automatic breast cancer detection in magnetic resonance imaging

Oliver Lester Saldanha et al. Commun Med (Lond). .

Abstract

Background: Over the next 5 years, new breast cancer screening guidelines recommending magnetic resonance imaging (MRI) for certain patients will significantly increase the volume of imaging data to be analyzed. While this increase poses challenges for radiologists, artificial intelligence (AI) offers potential solutions to manage this workload. However, the development of AI models is often hindered by manual annotation requirements and strict data-sharing regulations between institutions.

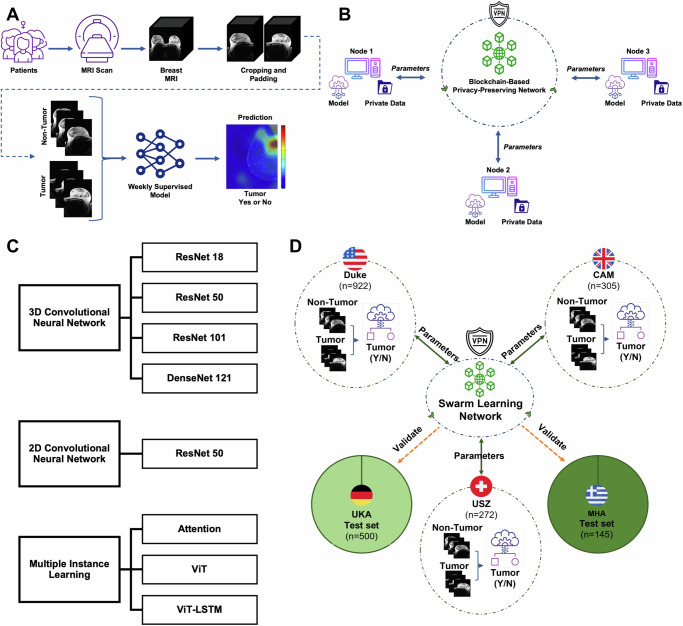
Methods: In this study, we present an integrated pipeline combining weakly supervised learning-reducing the need for detailed annotations-with local AI model training via swarm learning (SL), which circumvents centralized data sharing. We utilized three datasets comprising 1372 female bilateral breast MRI exams from institutions in three countries: the United States (US), Switzerland, and the United Kingdom (UK) to train models. These models were then validated on two external datasets consisting of 649 bilateral breast MRI exams from Germany and Greece.

Results: Upon systematically benchmarking various weakly supervised two-dimensional (2D) and three-dimensional (3D) deep learning (DL) methods, we find that the 3D-ResNet-101 demonstrates superior performance. By implementing a real-world SL setup across three international centers, we observe that these collaboratively trained models outperform those trained locally. Even with a smaller dataset, we demonstrate the practical feasibility of deploying SL internationally with on-site data processing, addressing challenges such as data privacy and annotation variability.

Conclusions: Combining weakly supervised learning with SL enhances inter-institutional collaboration, improving the utility of distributed datasets for medical AI training without requiring detailed annotations or centralized data sharing.

Plain language summary

Breast cancer screening guidelines are expanding to include more MRI scans, increasing the amount of imaging data doctors must analyze. This study explored how artificial intelligence (AI) can help manage this increased workload while overcoming challenges such as limited data sharing between hospitals and the need for detailed annotations on each image. Researchers used MRI scans from five hospitals in the US, Switzerland, the UK, Germany, and Greece to train and test AI models. They found that a specific type of AI model performed the best, and that training AI collaboratively across hospitals improved results compared to training at individual sites. This approach could make AI tools more effective and secure for use in healthcare, potentially improving breast cancer detection and patient outcomes.


Conflict of interest statement

Competing interests: J.N.K. declares consulting services for Owkin, France, and Panakeia, UK, and has received honoraria for lectures by Bayer, Eisai, MSD, BMS, Roche, Pfizer, and Fresenius. J.N.K. and D.T. hold shares in StratifAI GmbH, Germany. S.M. declares employment and shareholding with Osimis, Belgium. No other potential conflicts of interest are declared by any of the authors. The authors received advice from the customer support team of Hewlett Packard Enterprise (HPE) when performing this study, but HPE did not have any role in study design, conducting the experiments, interpretation of the results, or decision to submit for publication.

Figures

Fig. 1
Fig. 1. Schematic of the Weakly Supervised Learning (WSL) and Swarm Learning (SL) workflow.
A Schematic representation of the Deep Learning-based WSL workflow for breast cancer tumor detection on Magnetic Resonance Imaging (MRI) data, B Overview of the SL setup for a 3-node network, C Graphical representation of techniques and models architecture for benchmarking WSL with breast cancer 3D MRI data, D Combined representation of real-world SL-based WSL for Breast Cancer Tumor Detection and Data Split Ratio.
Fig. 2
Fig. 2. Benchmarking models on internal and external validation.
A Classification performance (area under the receiver operating curve, AUROC) for prediction of tumor on internal validation cohort, i.e., 20% of Duke cohort. The three shades of blue represent different parts of a single cohort, Duke, with the centralized model in dark blue comprising 80% of Duke. Error bars represent the standard deviation of AUROC values for each model across five repetitions of the experiment. Individual data points outside the whiskers indicate outliers from the five repetitions. B Classification performance (area under the receiver operating curve, AUROC) for prediction of tumor on external validation cohort, i.e., UKA. The number of patients used for prediction per cohort is 122 for Duke and 422 for UKA. Error bars represent the standard deviation of AUROC values for each model across five repetitions of the experiment. Individual data points outside the whiskers indicate outliers from the five repetitions. C Classification performance for prediction of the tumor using 3D-Resnet101 model trained using real-world swarm learning across three cohorts: Duke, USZ, and CAM. Its classification performance was evaluated on an external validation cohort, UKA, for tumor prediction. Local model performance was assessed using AUROC and DeLong’s test to compare it with swarm models. Error bars represent the standard deviation of AUROC values for each model across five repetitions of the experiment. Individual data points outside the whiskers indicate outliers from the five repetitions. The significance level was set at p < 0.05 (*P < 0.05, **P < 0.001), and median patient scores from five repetitions determined superior performance. D Classification performance for the prediction of tumors using the 3D-Resnet101 model was trained using real-world swarm learning across three cohorts: Duke, USZ, and CAM. Its classification performance was evaluated on an external validation cohort, MHA, for tumor prediction. Local model performance was assessed using AUROC and DeLong’s test to compare it with swarm models. Error bars represent the standard deviation of AUROC values for each model across five repetitions of the experiment. Individual data points outside the whiskers indicate outliers from the five repetitions. The significance level was set at p < 0.05 (*P < 0.05, **P < 0.001), and median patient scores from five repetitions determined superior performance. The training cohort from Duke is consistently represented by the dark blue color throughout the figure.
Fig. 3
Fig. 3. Visualization of the prediction on external cohorts trained on real-world 3D-ResNet-101 SL model illustrating the findings of our scientific study.
Each row in the visualization corresponds to the best predicted one patient from the external UKA or MHA cohort. The first column displays the center to which the patient belongs. The second column displays 16 slices of the original subtraction images (i.e., the contrast accumulation). The third column shows GradCAM + + visualizations. The last (fourth) column illustrates the results of the occlusion sensitivity analysis (OCA). A These are true positive examples. B False positive examples. While GradCAM++ highlights regions of the image that are irrelevant to the diagnosis, such as the contrast agent within the heart at the bottom part of the image, OCA focuses on the contrast-enhancing lesions and, thus, on the region that a radiologist would be looking at.

References

    1. Mann, R. M. et al. Breast cancer screening in women with extremely dense breasts recommendations of the European Society of Breast Imaging (EUSOBI). Eur. Radiol.32, 4036–4045 (2022). - PMC - PubMed
    1. Weinstein, S. P. et al. ACR appropriateness criteria® supplemental breast cancer screening based on breast density. J. Am. Coll. Radiol.18, S456–S473 (2021). - PubMed
    1. Pauwels, E. K. J., Foray, N. & Bourguignon, M. H. Breast cancer induced by X-ray mammography screening? a review based on recent understanding of low-dose radiobiology. Med. Princ. Pract.25, 101–109 (2016). - PMC - PubMed
    1. Bickelhaupt, S. et al. On a fractional order calculus model in diffusion weighted breast imaging to differentiate between malignant and benign breast lesions detected on X-ray screening mammography. PLoS ONE12, e0176077 (2017). - PMC - PubMed
    1. Wang, P. et al. Real-time automatic detection system increases colonoscopic polyp and adenoma detection rates: a prospective randomised controlled study. Gut68, 1813–1819 (2019). - PMC - PubMed

LinkOut - more resources