. 2025 Feb 6;8(1):189.
doi: 10.1038/s42003-025-07472-7.

Trichromacy is insufficient for mate detection in a mimetic butterfly

Affiliations

Trichromacy is insufficient for mate detection in a mimetic butterfly

Andrew Dang et al. Commun Biol. .

Abstract

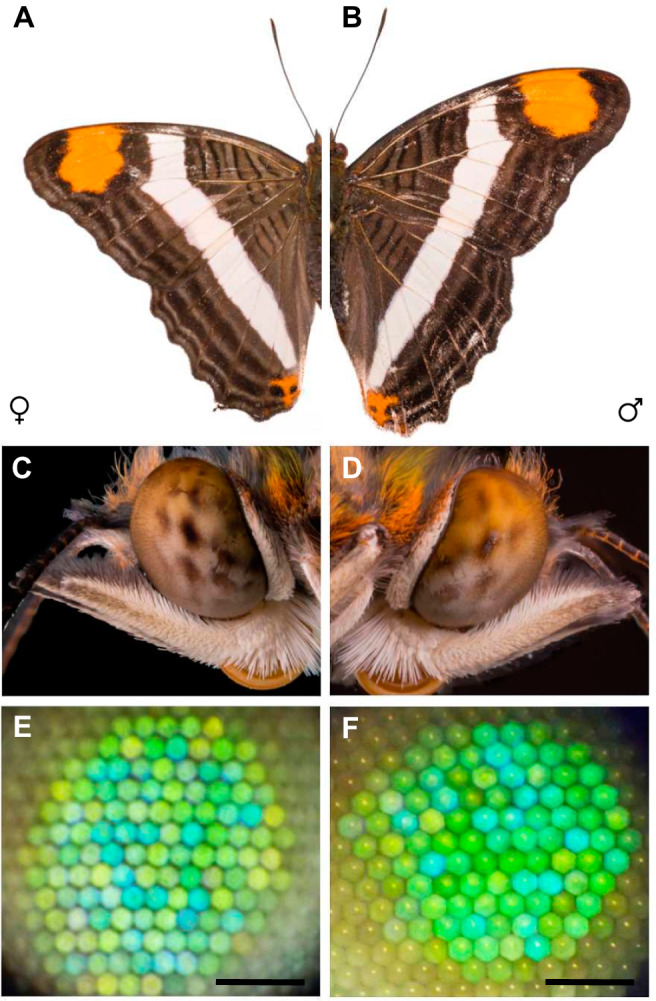
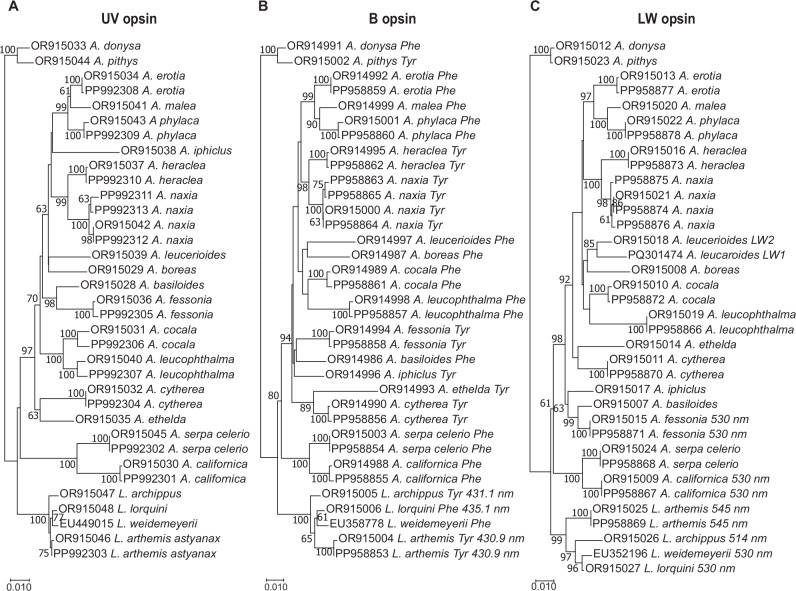
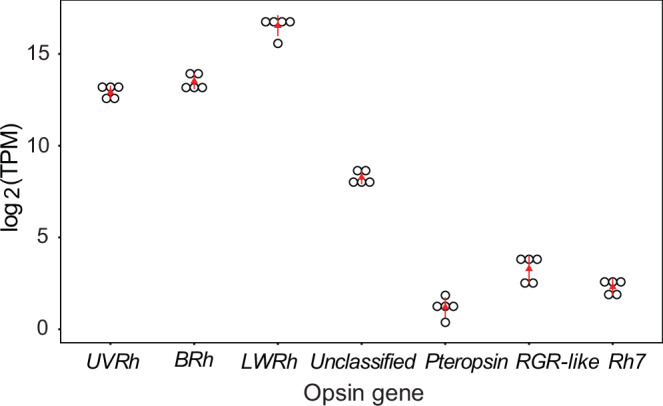
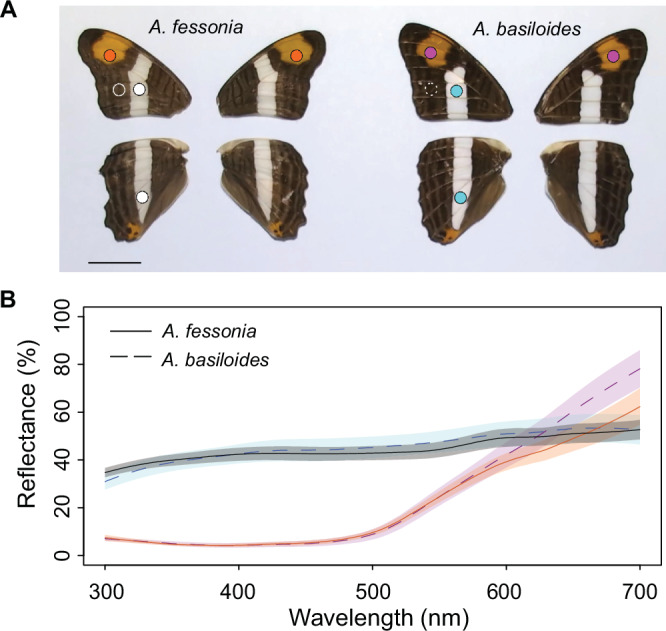
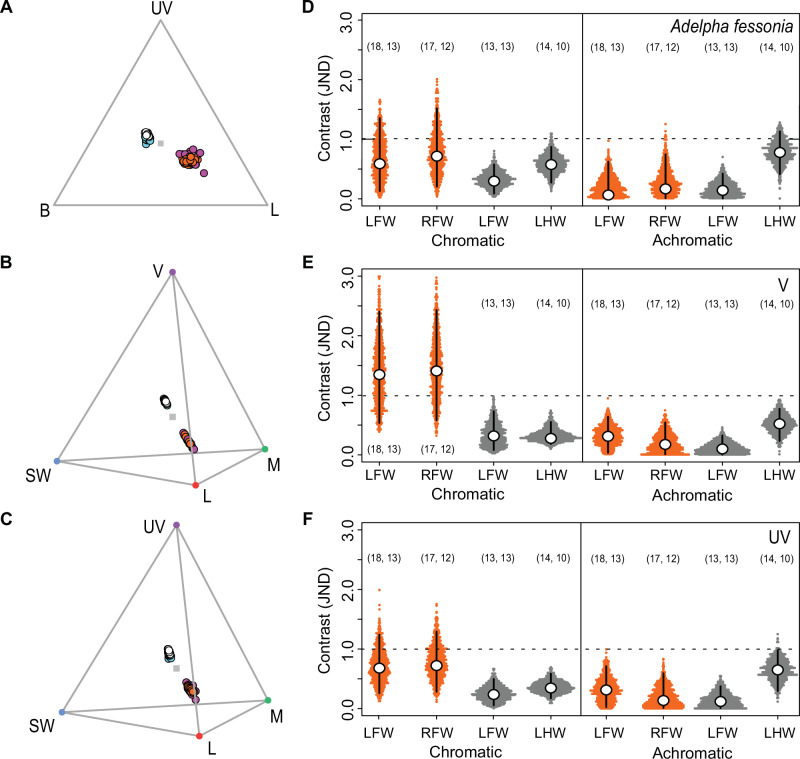
Color vision is thought to play a key role in the evolution of animal coloration, while achromatic vision is rarely considered as a mechanism for species recognition. Here we test the hypothesis that brightness vision rather than color vision helps Adelpha fessonia butterflies identify potential mates while their co-mimetic wing coloration is indiscriminable to avian predators. We examine the trichromatic visual system of A. fessonia and characterize its photoreceptors using RNA-seq, eyeshine, epi-microspectrophotometry, and optophysiology. We model the discriminability of its wing color patches in relation to those of its co-mimic, A. basiloides, through A. fessonia and avian eyes. Visual modeling suggests that neither A. fessonia nor avian predators can readily distinguish the co-mimics' coloration using chromatic or achromatic vision under natural conditions. These results suggest that mimetic colors are well-matched to visual systems to maintain mimicry, and that mate avoidance between these two look-alike species relies on other cues.


Conflict of interest statement

Competing interests: The authors declare no competing interests.

Figures

Fig. 1
Fig. 1. Adelpha fessonia wings, compound eyes, and eyeshine.
A Photographs of an Adelpha fessonia female wing and B an A. fessonia male wing. C Photographs of an A. fessonia female eye and D an A. fessonia male eye. E Photographs of A. fessonia female eyeshine and F male eyeshine. Scale bar = 100 μm.
Fig. 2
Fig. 2. Phylogenies of Adelpha UV, blue, and LW opsin-encoding mRNA transcripts and wavelength of peak absorbance (λmax) of the encoded blue- and LW-absorbing rhodopsins.
A UVRh, B BRh, and C LWRh maximum likelihood nucleotide phylogenies were reconstructed using full-length coding sequences, the HKY85 model, and 500 bootstrap replicates. Bootstrap support values > 60% are shown. B Blue opsin amino acid at site 195, either phenylalanine (Phe) or tyrosine (Tyr), and λmax values of the blue-absorbing rhodopsins, where known. C LW-absorbing rhodopsin λmax values, where known. All opsin transcripts appear to be single-copy except for A. leucerioides LWRh, which is duplicated. Specimen locality information for the sampled butterflies is given in Supplementary Data 1. Scale bar = substitutions/site.
Fig. 3
Fig. 3. Expression levels of Adelpha fessonia opsin genes in adult head (eye + brain) tissue.
mRNA transcripts measured using RNA-seq data (n = 5 individual butterflies) and kallisto quantification. Y axis is in transcripts per million on a log2 scale. Red triangles indicate median values, red lines indicate standard deviations, and open circles indicate individual data points.
Fig. 4
Fig. 4. Epi-microspectrophotometry and optophysiology of Adelpha fessonia eyes.
A Normalized absorbance spectra of Adelpha fessonia and A. californica long wavelength-absorbing rhodopsins measured by epi-microspectrophotometry. Experimental spectra of A. fessonia (n = 1 butterfly)(orange dots) and A. californica (n = 1 butterfly)(blue dots). LW rhodopsin template with peak absorbance at 530 nm (green line). B Normalized pupillary sensitivity of A. fessonia (n = 1 butterfly)(orange dots). The contributions of UV- (gray dotted line) and LW- (green dotted line) sensitive rhodopsins to the pupillary sensitivity are indicated by fits to a model that includes both UV (λmax = 355 nm) and LW (λmax = 530 nm) rhodopsins.
Fig. 5
Fig. 5. Limenitis blue-absorbing rhodopsin dark spectra based on heterologous expression in HEK293 cells and known spectral tuning sites.
A Dark spectra of wildtype Limenitis lorquini (n = 1 independent experiment), B wildtype L. arthemis (n = 1), and C Y195F mutant L. arthemis (n = 1) blue-absorbing rhodopsins. Spectra of B, C reproduced with permission from Frentiu et al.. Each construct was expressed 2–4 times in independent experiments with 11-cis-retinal, purified, and measured, and the experiment with the highest optical density was selected for further analysis. Each panel represents the average of 5–7 measurements (technical replicates) from the single best independent experiment for that construct. D Partial amino-acid alignment of the blue opsin of representative species indicating the location of two amino-acid sites, 135 and 195, with known spectral tuning effects,,.
Fig. 6
Fig. 6. Photographs and wing reflectance spectra of Adelpha fessonia and A. basiloides mimetic butterflies.
A Photographs of dorsal wings of A. fessonia (left) and A. basiloides (right) with scale bar representing 1 centimeter. Circles indicate parts of the wings where reflectance spectra were measured. Orange dots = A. fessonia left and right dorsal orange forewing patches; white dots = A. fessonia left dorsal forewing and hindwing white stripes; white circle, solid line = A. fessonia left dorsal forewing brown; pink dots = A. basiloides dorsal left and right orange forewing patches; blue dots = A. basiloides left dorsal forewing and hindwing white patches; white circle, dashed line = A. basiloides left dorsal forewing brown. B Reflectance measurements taken from A. fessonia left (n = 13 independent measurements) and right (n = 12) dorsal orange forewing patches (orange dots in A), A. fessonia left dorsal forewing (n = 13) and hindwing (n = 10) white stripes (white dots), A. basiloides left (n = 18) and right (n = 17) dorsal orange forewing patches (pink dots), and A. basiloides left dorsal forewing (n = 13) and hindwing (n = 14) white wing stripes (blue dots). Shaded areas represent standard deviations and lines (solid, A. fessonia; dashed, A. basiloides) represent means.
Fig. 7
Fig. 7. Wing reflectance spectra of Adelpha fessonia and A. basiloides plotted in the trichromatic color space of Adelpha fessonia and the tetrachromatic color spaces of the UV-sensitive and violet-sensitive bird visual systems, and just noticeable differences (JNDs) estimated from the corresponding visual models.
The dorsal orange patches and white stripes of mimetic Adelpha fessonia and A. basiloides butterflies are likely indistinguishable to Adelpha fessonia and their avian predators in the wild. The dorsal orange patch of A. fessonia (orange dots, n = 25 independent measurements) and A. basiloides (pink dots, n = 35), and the dorsal white stripes of A. fessonia (white dots, n = 23) and A. basiloides (blue dots, n = 27) mapped in the trichromatic color space of A the A. fessonia visual system, and the tetrahedral color spaces of B the violet-sensitive and C the UV-sensitive, avian visual systems. For A. fessonia, UV = ultraviolet, B = blue, and L = LW rhodopsin. For birds, UV = ultraviolet, V = violet, SW = blue, M = RH2, L = LWS rhodopsin. Right: Distances between the two species’ orange and white wing color patches as viewed through D the A. fessonia visual system, E the violet-sensitive, and F the UV-sensitive avian visual systems. Color distances are in units of chromatic contrast (JND) between A. fessonia and A. basiloides wing colors with a JND threshold (dotted line) of 1. Open circles represent mean JND values estimated from 1000 bootstrapped replicates with black bars representing 95% confidence intervals. Orange represents individual bootstrapped JNDs derived from comparisons of A. fessonia and A. basiloides orange wing colors and dark gray represents individual bootstrapped JNDs derived from comparisons of A. fessonia and A. basiloides white wing colors. Sample sizes of wing reflectance spectra used to estimate these mean JNDs via bootstrapping are indicated in parentheses with numbers for A. fessonia on the right and numbers for A. basiloides on the left. LFW = left forewing, RFW = right forewing, LHW = left hindwing.

References

    1. Prudic, K. L. & Khera, S. Isolation, identification, quantification potential defensive compounds in the viceroy butterfly and its larval host-plant, Carolina willow. J. Chem. Ecol.33, 1149–1159 (2007). - PubMed
    1. Prudic, K. L., Timmermann, B. N., Papaj, D. R., Ritland, D. B. & Oliver, J. C. Mimicry in viceroy butterflies is dependent on abundance of the model queen butterfly. Commun. Biol.2, 68 (2019). - PMC - PubMed
    1. Oreilly, L. J., Agassiz, D., Neil, T. R. & Holderied, M. W. Deaf moths employ acoustic Müllerian mimicry against bats using wingbeat-powered tymbals. Sci. Rep.9, 1444 (2019). - PMC - PubMed
    1. Rowland, H. M., Ihalainen, E., Lindström, L., Mappes, J. & Speed, M. P. Co-mimics have a mutualistic relationship despite unequal defences. Nature448, 64–67 (2007). - PubMed
    1. Thurman Tj Seymoure, B. M. A bird’s eye view of two mimetic tropical butterflies: coloration matches predator’s sensitivity. J. Zool.298, 159–168 (2016).