. 2025 May;22(5):1070-1080.
doi: 10.1038/s41592-024-02590-2. Epub 2025 Feb 6.

Live imaging of the extracellular matrix with a glycan-binding fluorophore

Affiliations

Live imaging of the extracellular matrix with a glycan-binding fluorophore

Antonio Fiore et al. Nat Methods. 2025 May.

Abstract

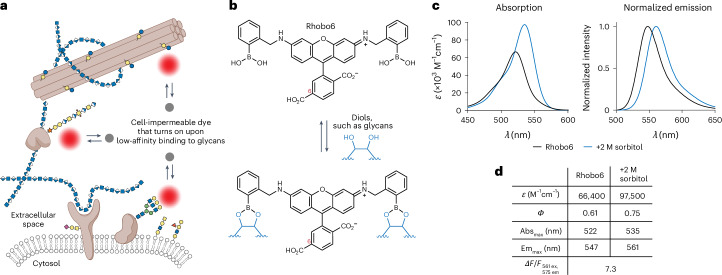
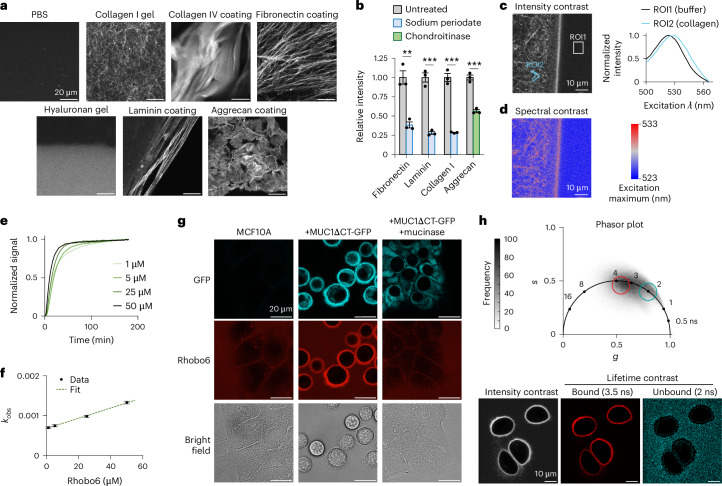
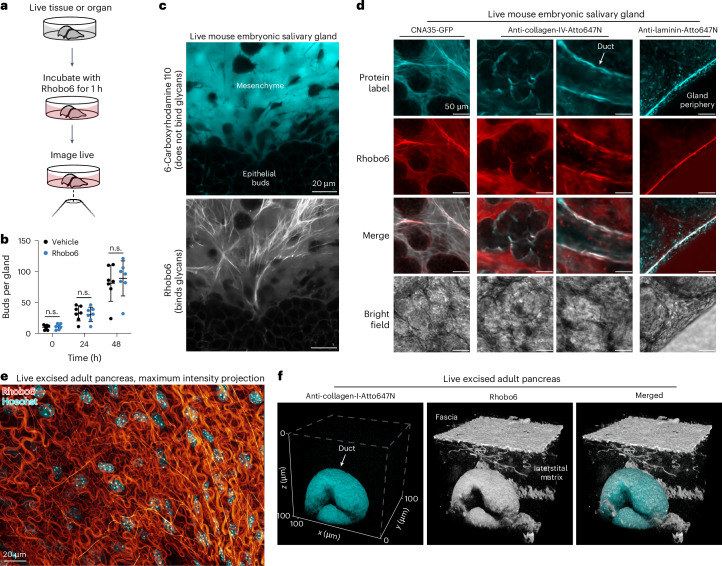
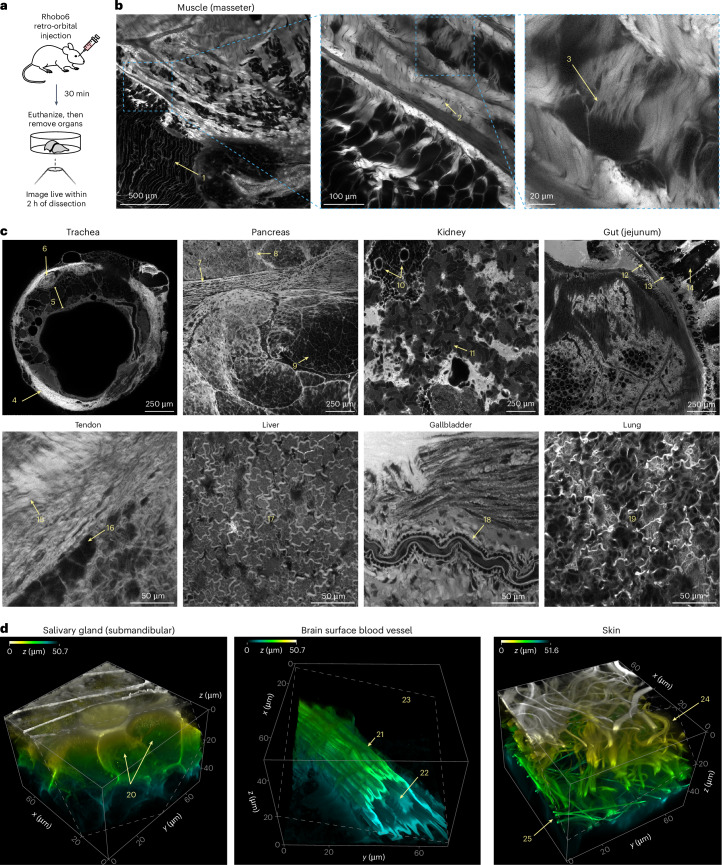
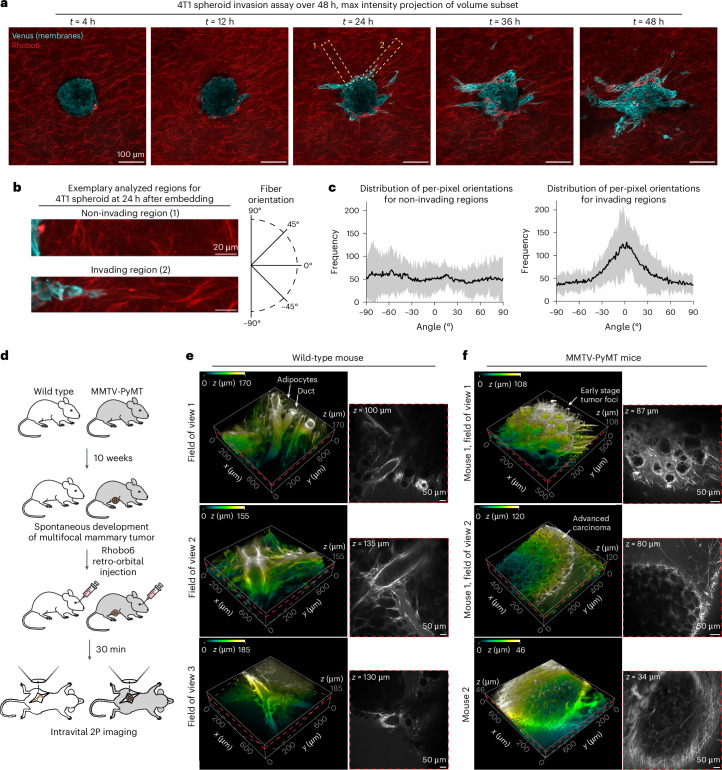
All multicellular systems produce and dynamically regulate extracellular matrices (ECMs) that play essential roles in both biochemical and mechanical signaling. Though the spatial arrangement of these extracellular assemblies is critical to their biological functions, visualization of ECM structure is challenging, in part because the biomolecules that compose the ECM are difficult to fluorescently label individually and collectively. Here, we present a cell-impermeable small-molecule fluorophore, termed Rhobo6, that turns on and red shifts upon reversible binding to glycans. Given that most ECM components are densely glycosylated, the dye enables wash-free visualization of ECM, in systems ranging from in vitro substrates to in vivo mouse mammary tumors. Relative to existing techniques, Rhobo6 provides a broad substrate profile, superior tissue penetration, non-perturbative labeling, and negligible photobleaching. This work establishes a straightforward method for imaging the distribution of ECM in live tissues and organisms, lowering barriers for investigation of extracellular biology.


Conflict of interest statement

Competing interests: A.F., G.Y., W.K. and K.P. are authors on a patent application filed by the Howard Hughes Medical Institute relating to this work (US Application Serial No. 63/637,164). The remaining authors declare no competing interests.

Figures

Fig. 1
Fig. 1. Photophysical characterization of the glycan-binding fluorophore Rhobo6.
a, ECM labeling strategy. A cell-impermeable dye is added to a biological sample such that it disperses into extracellular spaces. Upon reversible association with glycoconjugates (colored shapes) of the extracellular matrix, the dye increases its fluorescence output. b, Rhobo6 structure and propensity for glycan binding. The carboxylic acid on the 6-position of Rhobo6 (red numbering) is charged at physiological pH, rendering the molecule cell-impermeable; the pKa for ortho-aminomethylphenyl boronic acid is in the range of 5 to 7 (ref. ), meaning the boronate and borate ester may dominate in aqueous buffer at physiological pH. c, Absorption and normalized emission spectra for Rhobo6 in unbound (5 µM dye in PBS) and bound (5 µM dye in PBS containing 2 M sorbitol) states. Emission spectra were measured with excitation wavelength at 490 nm. For 2P spectra, see Extended Data Figure 1i. ε, molar extinction. d, Table of photophysical properties. ε is reported at peak absorption. Quantum yield (Φ) is reported as the average value measured between 475 nm and 535 nm. Contrast is measured as the relative fluorescence signal change between bound and unbound states (ΔF/F), when exciting at 561 nm and detecting fluorescence signal at 575 nm. Because of red shift in both absorption and emission, the value is dependent on both excitation and emission parameters (see also Extended Data Fig. 1e–h). Absmax, wavelength of maximum absorption; Emmax, wavelength of maximum emission. Source data
Fig. 2
Fig. 2. In vitro and in cellulo validation of Rhobo6 labeling.
a, Rhobo6 labeling of purified ECM components. Substrates were prepared as glass coatings or gels (Methods), incubated with Rhobo6 at 5 µM for 1 h in PBS, and imaged using a confocal microscope. Contrast is not normalized across images. b, ECM components were treated with 10 mM sodium periodate (blue) or with chondroitinase ABC (green), and signal intensity relative to the untreated condition was quantified from confocal microscopy images. Periodate and chondroitinase treatment are expected to cleave a subset of glycans on the substrates shown. For representative images used for quantification, see Extended Data Figure 3a. n = 3; error bars represent s.e.m. P values were determined using an unpaired two-tailed t-test; **P < 0.005; ***P < 0.0005. c, Spectral imaging at the boundary of a collagen I gel and the surrounding buffer containing 5 µM Rhobo6, performed through an excitation scan (500–566 nm) and detection of fluorescence at 575–630 nm (Supplementary Table 1). The intensity contrast image (left) was obtained at 560 nm excitation with manually traced ROIs to capture an area rich in collagen fibers and an area in the surrounding buffer. Excitation spectra (right) correspond to the manually drawn ROIs. d, A spectral contrast image generated by plotting excitation maxima for each pixel in c. Two-pixel bins were used in the image. e, Time course of Rhobo6 fluorescence signal upon incubation with collagen I gels at varying concentrations. Binding curves were used to extract a value for kobs at each concentration (Methods). f, The linear fit between kobs and Rhobo6 concentrations from e allows extrapolation of the binding constants kon and koff. An apparent Kd of 53 µM was determined by the ratio of the two. Error bars represent the 95% confidence interval for the fitted kobs values. g, Confocal microscopy of MCF10A cells labeled with Rhobo6. Expression of GFP-MUC1∆CT was induced through the addition of doxycycline. Mucin domains, which are amino-terminal to GFP, were degraded enzymatically through live-cell treatment with the mucinase StcE. Mucin overexpression in these cells induces membrane protrusions (villi), which are resolved as a thick halo around the cell; mucin overexpression also causes the cells to partially lift from their growth substrate, resulting in a spherical appearance with no loss in viability. Contrast is normalized for each channel across experimental conditions. h, FLIM microscopy of MCF10A+GFP-MUC1∆CT cells labeled with Rhobo6. Top, phasor plot of lifetime distribution, with ROIs marking unbound and bound Rhobo6 populations. Bottom, intensity contrast image compared with lifetime bandpass images for each population (Supplementary Table 1). The broad distribution of observed lifetimes could be due to a multitude of possible binding modes, as well as variability in glycan structure. g, cosine transform; s, sine transform. Source data
Fig. 3
Fig. 3. Labeling of excised tissues by bathing in Rhobo6-containing medium.
a, Schematic of the labeling approach. Freshly dissected or cultured tissues were labeled with 5 µM Rhobo6 for 1 h, with sample-specific medium (Methods). b, Growth and morphogenesis of mouse embryonic salivary glands upon incubation with Rhobo6; n = 14 glands were split into two paired groups, with each pair corresponding to glands from a single embryo. The first group was incubated with 5 µM Rhobo6 in medium containing 0.5% DMSO, and the second group was incubated in medium containing 0.5% DMSO, as a vehicle control. Growth and morphogenesis were assessed by counting epithelial buds every 24 h for 2 days. Paired groups were compared using paired two-tailed t-tests; error bars represent s.d.; n.s., not significant. c, Mouse embryonic submandibular salivary gland (E14) was cultured ex vivo for 5 days, then labeled by bathing concurrently with Rhobo6 and 6-carboxyrhodamine 110. The latter dye differs from Rhobo6 only in that it does not contain the two ortho-aminomethylphenyl boronic acid groups, which are necessary for binding to extracellular glycans. Images were denoised (see Extended Data Figure 4b,c for comparison of raw and denoised salivary gland images; Supplementary Table 1 details the image-processing workflow for all datasets). d, Comparison of live Rhobo6 labeling to live labeling with protein-based affinity reagents against common ECM components, including fibrous collagen (CNA35), network-forming collagen (anti-collagen-IV), and laminins. Glands were incubated with purified CNA35-GFP or Atto647N-conjugated antibodies in solution along with Rhobo6, and were imaged using a confocal microscope. Contrast was not normalized. Images were denoised (Supplementary Table 1). e, Freshly dissected and exsanguinated mouse pancreatic tissue, labeled by bathing with Rhobo6 (red), to highlight ECM, and Hoechst (cyan), to highlight nuclei. The image shows a maximum intensity projection over a depth spanning 23 µm and showing fascia. Images were denoised (Supplementary Table 1). f, Two-color labeling of exsanguinated adult mouse pancreatic tissue labeled with both Rhobo6 (white) and an anti-collagen-I-Atto647N (cyan) antibody. Tissue was labeled by bathing for 1 h with both probes, and imaged with a confocal microscope. The image shows three-dimensional reconstruction of the 106 µm × 106 µm × 100 µm volume. Source data
Fig. 4
Fig. 4. Rhobo6 is distributed across mouse organs and labels the ECM upon retro-orbital injection.
a, Schematic of the labeling approach. Anesthetized mice were injected retro-orbitally with 100 µl of 1 mM Rhobo6 in PBS containing 10% DMSO, which corresponds to 100 nmol of Rhobo6, or 3.5 mg kg–1 body weight for a 20 g mouse. Mice were allowed to recover for 30 min on a warming pad, and were then euthanized by cervical dislocation. Live tissues were collected, placed on a glass-bottom dish, and imaged within 2 h of dissection. b, 2P image of a 2 mm by 2 mm area of muscle tissue (masseter). Insets show sequential crops of the original image, highlighting ECM features made visible by Rhobo6 labeling. For annotations of numbered landmarks, see c. c, Individual fields of view cropped from 2 mm by 2 mm 2P images of the indicated tissues. Numbers in yellow correspond to features consistent with histological annotations,. Muscle (in b): (1) skeletal muscle fibers, (2) collagen-rich fascia, and (3) basal lamina surrounding myofibrils. Trachea: (4) tracheal cartilage ring, (5) submucosal layer with basement membrane, and (6) a tracheal gland encased in ECM. Pancreas: (7) longitudinal section of a duct, (8) the cross section of a duct, and (9) acinar tissue. Kidney: (10) collecting tubule and (11) convoluted tubules. Jejunum: (12) muscularis mucosa, (13) crypts, and (14) villi. Tendon: (15) fascia and (16) fibroblasts. Liver: (17) the entire field of view shows the fascia layer superficial to the hepatocyte layer. Gallbladder: (18) longitudinal section of an arteriole. Lung: (19) the entire field of view shows alveolar tissue encased in ECM. All tissues, including images in b and d, were acquired on the same day from four mice of the same strain and age (Methods). Contrast was not normalized across samples. d, Three-dimensional reconstructions of three tissues, from 2P microscopy volumes. Histological annotations are numbered in yellow. Salivary gland: (20) epithelial bud cell interiors from which Rhobo6 is excluded. Brain: (21) a blood vessel on the brain surface, (22) red blood cells that are excluded from Rhobo6 labeling within the vessel and (23) brain tissue that is not labeled by Rhobo6, therefore appearing dark. Skin: (24) collagen fibers and (25) elastin fibers. Contrast and the depth-coded lookup table were not normalized across samples. Images in d were denoised (Supplementary Table 1).
Fig. 5
Fig. 5. Imaging of ECM in matrix-embedded breast cancer spheroids and in a mouse model of breast cancer.
a, Spheroid invasion assay time course. 4T1 spheroids expressing membrane-tethered Venus were embedded in an ECM scaffold (80% collagen type I, 20% Matrigel), then bathed in serum-containing medium with 5 µM Rhobo6. Volumes of 553 µm × 553 µm × 162 µm were acquired once per hour over 2 days using 2P microscopy. Maximum intensity projections over 12 µm are shown. Yellow boxes represent examples of non-invading (1) and invading (2) regions shown in b. b, Left, example non-invading and invading spheroid regions used for fiber-orientation analysis, cropped from a (Methods). Right, frame of reference for quantification, in which fibers of 0° are parallel relative to the long axis of the ROI. c, Distribution of per-pixel orientations from −90° to 90° in non-invading (left) and invading (right) ROIs, plotted as an average of n = 3 regions for each of n = 3 spheroids. Orientation was evaluated for every pixel on the basis of the structure tensor using OrientationJ. Shaded bands indicate the s.d. d, Schematic of the experimental timeline, along with the intravital imaging strategy for wild-type and mammary tumor-bearing MMTV-PyMT mice. e, Rhobo6 imaging with three fields of view from the same mammary gland marking the ECM surrounding normal ductal architecture. Left, volume rendering (color-coding for depth was applied). Arrows indicate adipocytes and epithelial ducts. Right, a single confocal slice from the adjacent volume (red dashed plane, with z height indicated) illustrating Rhobo6 labeling. Contrast is not normalized. Images were denoised (Supplementary Table 1). f, The same as in e, for two MMTV-PyMT mice. Two fields of view are presented for mouse 1 and one field of view is shown for mouse 2. Arrows indicate early-stage and late-stage carcinomas. Contrast is not normalized. Images were denoised (Supplementary Table 1). Source data
Extended Data Fig. 1
Extended Data Fig. 1. Rhobo6 cell impermeability and additional photophysical characterization.
a, Comparison between Rhobo and Rhobo6 cell permeability over time. PC3 cells were incubated with Rhobo or Rhobo6 at 5 µM concentration in serum-containing media. Wells were then imaged directly after addition of dye (t = 0 h) and following a 1, 2, and 6 h incubation at 37 °C and 5% CO2. Cell surface signal is absent in this experiment due to excitation at 488 nm (cf. (e)-(h)) and the presence of serum-containing media (cf. Extended Data Fig. 3d). b, Quantified intracellular signal for Rhobo and Rhobo6 over time as determined by manually drawn regions of interest of N = 9 cells per condition. Error bars represent SEM. c, Monosaccharides and monosaccharide analogs used in (d). d, Quantified fluorescence of Rhobo6 measured by exciting at 555 nm and detecting fluorescence intensity maxima between 570 and 630 nm. All sugars were prepared in PBS solutions at 200 mM with 5 µM Rhobo6, pH 7.3-7.4, and incubated for 1 h at room temperature. N = 3, error bars represent SEM. P values were determined by unpaired two-tailed t-test with Welch’s correction, relative to dye only control; *P < 0.05. e, Relative change in extinction coefficient between bound and unbound Rhobo6 as a function of excitation wavelength calculated as (εboundunbound)/εunbound. Position of standard laser lines 488 nm and 561 nm are shown to highlight that longer wavelength excitation preferentially excites bound dye, enhancing observed contrast. f, Emission spectra of bound and unbound Rhobo6 normalized for 561 nm excitation. A standard emission filter for red fluorescence (575 nm long pass [LP]) will preferentially collect light from bound dye, enhancing observed Contrast. g, Emission spectra of bound and unbound Rhobo6 normalized to 488 nm excitation (cf. Methods). A standard emission filter for green fluorescence (545 nm short pass [SP]) will preferentially collect light from unbound dye, reducing observed contrast. h, Measured contrast (calculated as ΔF/F between bound and unbound Rhobo6), as function of emission wavelength for 490 nm and 561 nm excitation. The plot agrees with renormalized spectral data in (f)-(g), with measured optimal contrast at 561 nm excitation and 570–580 nm emission. i, Two-photon excitation spectra for Rhobo6 in 100 mM phosphate buffer, pH 7.4 (unbound state) and 100 mM phosphate buffer containing 1 M galactose, pH 7.4 (bound state). The measured excitation spectrum of Rhodamine B is shown for reference. j, Normalized emission spectra of Rhobo6 incubated with various concentrations of sorbitol at pH 6, 7, and 8. At increasing pH, the concentration of sorbitol required to obtain a red-shifted population decreases, indicating increased Rhobo6 affinity towards sorbitol, as expected. A vertical red line is shown at 552 nm, corresponding to the peak emission of unbound dye at each pH. Source data
Extended Data Fig. 2
Extended Data Fig. 2. Application of Rhobo6 to a commercial glycan array.
a, Normalized fluorescence signal of Rhobo6 measured by quantifying three glycan arrays with four glycan replicates each, printed on a single glass slide. Fluorescence signal was background corrected and normalized within each array. Negatively charged glycans are highlighted in a darker shade of gray. N = 12 for glycans, N = 24 for negative control, error bars represent standard deviation. Statistical significance was determined through unpaired two-tailed t-test with Welch’s correction, relative to the negative control group; NS = not significant (orange text), ***P < 0.0005. For all glycans not marked ‘NS’, average signal was confirmed to be greater than two times the standard deviation of local background. b, Array glycans and glycan linkers. Glycans marked ‘NS’ in (a) are colored orange. Note that linker ‘Sp4’ carries a carboxylic acid, which is negatively charged at physiological pH. Source data
Extended Data Fig. 3
Extended Data Fig. 3. In vitro and in cellulo Rhobo6 characterization, related to Fig. 2.
a, Representative fields of view from triplicates shown in Fig. 2b, along with additional Laminin isoforms 111 LN and 521 LN. Contrast is normalized within each untreated and treated substrate pair. Signal intensity is reduced upon treatment, as quantified in Fig. 2c. b, Frames extracted from 9.6 h imaging, at one frame per min, on a coated aggrecan substrate incubated with 5 µM Rhobo6. ROIs analyzed in (c) are highlighted in the first frame. c, Time trace of signal, calculated as mean intensity within three different manually traced ROIs, from (b). Photobleaching was not observed over the course of imaging. d, Effect of imaging buffer, mucin expression, and cell fixation on cell surface Rhobo6 signal. MCF10A + GFP-MUC1∆CT cells were incubated with doxycycline to induce GFP-tagged mucin expression, and imaged in different buffers containing 5 µM Rhobo6. PBS shows the best signal-to-background ratio. Cell surface signal can be partially competed away by addition of 200 mM sorbitol (cf. Extended Data Fig. 1d), confirming that Rhobo6 binding is diol-dependent and reversible. DMEM/F12 media contains 17.5 mM d-Glucose, likely contributing to a higher background than PBS. Supplementation of DMEM/F12 with the remaining complete media components (cf. Methods) results in the lowest observed signal-to-background ratio, likely due to the abundance of glycoconjugates in serum. MCF10A cells that were not induced to express GFP-MUC1∆CT were also imaged in PBS and exhibited dramatically lower cell surface Rhobo6 labeling, possibly due to the low density of binding sites on these cells. Finally, mucin-expressing cells were imaged after fixation with 4% paraformaldehyde; as a result of the fixation, membrane integrity is compromised, allowing Rhobo6 to accumulate in the cytosol. Rhobo6 is therefore not suitable for use with chemically fixed samples as it will accumulate non-specifically in fixed cells. Source data
Extended Data Fig. 4
Extended Data Fig. 4. Rhobo6 toxicity and, reversibility in comparison to Rhobo, related to Fig. 3.
a, Brightfield images of a representative pair of glands from Fig. 3b. b, Non-denoised (original) image of embryonic salivary gland labeled with Rhobo6, corresponding to the denoised version shown in Fig. 3c. Inset shows comparison between original and denoised dataset, confirming that artifacts were not introduced during the denoising process. Denoise was performed through Nikon NIS Elements AI Denoise (cf. Supplementary Table 1). Line plot of red region is reported in (c). c, Line plot of red outlined region from (b). Denoising increases signal to noise without altering biological features. d, Mouse embryonic salivary glands labeled with 5 µM Rhobo or Rhobo6, along with Hoechst (nuclear stain) and NucSpot650 (dead cell stain). Glands were incubated for 1 h with all probes and imaged. Rhobo6 labeling is confined in the extracellular space, but colocalizes with dead cells due to compromised membrane integrity (arrows, cf. Extended Data Fig. 3d). On the other hand, the cell permeable dye Rhobo labeling accumulates intracellularly in both live and dead cells. e, Glands from (d) were washed three times over the course of 3 h with DMEM/F12. Rhobo6 labeling was rapidly reversible, while Rhobo labeling was not diminished by washing over the course of the experiment. Rhobo images are contrast normalized across (d) and (e) and Rhobo6 images are independently normalized across (d) and (e). Notably, the cell permeable dye Rhobo is not able to label structures of the extracellular matrix in these glands, likely due to cytosolic sequestration. f, A salivary gland was incubated with 5 µM Rhobo6 in DMEM/F12, imaged, washed to remove Rhobo6 labeling, then incubated once again with Rhobo6 in DMEM/F12 containing 10% fetal bovine serum (FBS) and imaged. Source data
Extended Data Fig. 5
Extended Data Fig. 5. Rhobo6 diffusion in tissue, labeling of decellularized tissue, and compatibility with STED microscopy.
a, Scheme for Rhobo6 diffusion experiment. A freshly excised tissue sample was incubated with Rhobo6 for 1 h, then removed from solution and sliced dry to expose a cross-section that was not in contact with the dye solution. The newly cut surface was placed face down on a dry coverslip and imaged. b, Mouse muscle tissue labeled as described in (a). c, Decellularized mouse tissues. Mouse kidney (left) and heart (right) slices were decellularized (cf. Methods), labeled with Rhobo6 and Hoechst for 1 h, then imaged. The absence of Hoechst labeling confirms successful decellularization. d, STED image of mouse pancreatic ECM obtained by imaging freshly excised tissue labeled with Rhobo6. Depletion was achieved with a 660 nm laser. e, Three regions of interest (ROIs) from (d), comparing confocal and STED imaging. Contrast is not normalized across imaging conditions and fields of view. Both confocal and STED images were denoised (cf. Supplementary Table 1). f, Intensity plot of red line from denoised images in (e) displaying the increased resolving power achieved by STED microscopy when compared to diffraction-limited confocal microscopy. Source data
Extended Data Fig. 6
Extended Data Fig. 6. ECM labeling in non-mammalian organisms.
a, Live, excised adult Drosophila brain was labeled by bathing with 5 µM Rhobo6 in saline. Imaging at different planes revealed labeling surrounding landmarks in the fly brain, including neuron tracts between the optic lobe and the central brain, the central complex, and the mushroom body (dashed boxes). Images were denoised (cf. Supplementary Table 1). b, Mean intensity projection of a confocal volume capturing the mushroom body in a Drosophila brain. The sample endogenously expressed GFP in neuronal cells and was labeled with Rhobo6 upon dissection as in (a) (cf. Methods). Rhobo6 labeling was excluded from cell interiors, as expected. Images were denoised (cf. Supplementary Table 1). c, Brightfield and confocal fluorescence images of a whole C. elegans injected with 10 pL of 100 µM Rhobo6 in PBS containing 1% DMSO. Contrast is normalized between PBS-injected and Rhobo6 injected animals. Inset is a crop and enlargement of the oviduct region, showing Rhobo6 labeling of that structure (arrows). d, Max intensity projections of confocal volumes taken at the oviduct of animals endogenously expressing Nidogen-1-mNeonGreen (Nid-1-GFP) to highlight oviduct surfaces, co-localized to Rhobo6 labeling. Rhobo6 signal is enriched at the sp-ut valve within the lumen of the oviduct. Rhobo6 does not label the Nid-1-rich oviduct basement membrane, which is not in contact with the lumen of gonad arm. e, Time course of wound healing in zebrafish larvae (8d.p.f.) incubated with 5 µM Rhobo6 in tank water. Tail nicks (arrows) were necessary for dye delivery. Structures of the tail ECM and notochord are labeled. f, Max intensity projection of an Arabidopsis root after labeling overnight with 5 µM Rhobo6 in pure water (cf. Methods). Root cell surfaces are labeled.
Extended Data Fig. 7
Extended Data Fig. 7. Comparison between 2-photon Rhobo6 imaging and label-free ECM imaging techniques.
a-c, Gut (jejunum), muscle (masseter), and pancreas from both a control mouse and a mouse retro-orbitally injected with 100 µl of 1 mM Rhobo6 in PBS containing 10% DMSO, which corresponds to 100 nmol of Rhobo6, or 3.5 mg/kg for a 20 g mouse. Rhobo6-injected animals were imaged using second harmonic generation microscopy (SHG), two photon excitation autofluorescence (2 P autofluorescence, also known as TPEF) and two photon excitation fluorescence (2 P Rhobo6). Fields of view were imaged with a low light dosage highlighting the efficiency of 2 P Rhobo6 compared to SHG and TPEF, followed by a high light dosage for SHG and TPEF, in order to obtain contrast with those methods (cf. Supplementary Table 1). Contrast was normalized across all low dosage images within each tissue type. High dosage SHG images are normalized to each other and high dosage TPEF images are not normalized to any other image. Reported laser power is the average measured power at the sample plane for 120 fs pulses at 80 MHz repetition rate.
Extended Data Fig. 8
Extended Data Fig. 8. Rhobo6 influence on invasive potential of 4T1 spheroids and immunostaining of wild-type and tumor-bearing mouse mammary glands, related Fig. 5.
a, Spheroids were incubated with media containing 0.5% DMSO (vehicle) or with media containing 5 µM Rhobo6 and 0.5% DMSO (N = 16 spheroids per condition). Spheroids were imaged with a widefield microscope at t = 0 after embedding and incubation, then every 24 h for 2 days, and percent invading area was calculated (cf. Methods). Statistical analysis was performed via two-way ANOVA and Sidak’s multiple comparison test, with the assumption of a single pooled variance; NS = not significant. b, Brightfield images of representative organoids from (a). Traced regions corresponding to the core spheroid area (yellow) and traced regions corresponding to the entire spheroid, including all invading protrusions (magenta), were used to calculate percent invading area (cf. Methods). c, Immunofluorescence of fixed and wholemounted mammary glands using phalloidin (yellow) and CNA35-GFP (cyan) to mark filamentous actin and fibrillar collagen, respectively, and DAPI to stain cell nuclei (magenta). Two fields of view are shown for each of the mammary glands presented in Fig. 5, resected from the wild-type mouse (left) and MMTV-PyMT mouse 1. Source data

Update of

References

    1. Wu, D., Yamada, K. M. & Wang, S. Tissue morphogenesis through dynamic cell and matrix Interactions. Annu. Rev. Cell Dev. Biol.39, 123–144 (2023). - PMC - PubMed
    1. Chaudhuri, O., Cooper-White, J., Janmey, P. A., Mooney, D. J. & Shenoy, V. B. Effects of extracellular matrix viscoelasticity on cellular behaviour. Nature584, 535–546 (2020). - PMC - PubMed
    1. Nerger, B. A. et al. Local accumulation of extracellular matrix regulates global morphogenetic patterning in the developing mammary gland. Curr. Biol.31, 1903–1917 (2021). - PMC - PubMed
    1. Hughes, A. J. et al. Engineered tissue folding by mechanical compaction of the mesenchyme. Dev. Cell44, 165–178 (2018). - PMC - PubMed
    1. Möckl, L. et al. Quantitative super-resolution microscopy of the mammalian glycocalyx. Dev. Cell50, 57–72 (2019). - PMC - PubMed

LinkOut - more resources