. 2025 Feb 6;16(1):3.
doi: 10.1186/s13100-024-00339-4.

Targeted detection of endogenous LINE-1 proteins and ORF2p interactions

Affiliations

Targeted detection of endogenous LINE-1 proteins and ORF2p interactions

Mathias I Nielsen et al. Mob DNA. .

Abstract

Background: Both the expression and activities of LINE-1 (L1) retrotransposons are known to occur in numerous cell-types and are implicated in pathobiological contexts such as aging-related inflammation, autoimmunity, and in cancers. L1s encode two proteins that are translated from bicistronic transcripts. The translation product of ORF1 (ORF1p) has been robustly detected by immunoassays and shotgun mass spectrometry (MS). Yet, more sensitive detection methods would enhance the use of ORF1p as a clinical biomarker. In contrast, until now, no direct evidence of endogenous L1 ORF2 translation to protein (ORF2p) has been shown. Instead, assays for ORF2p have been limited to ectopic L1 ORF over-expression contexts and to indirect detection of endogenous ORF2p enzymatic activity, such as by the sequencing of de novo genomic insertions. Immunoassays for endogenous ORF2p have been problematic, producing apparent false positives due to cross-reactivities, and shotgun MS has not yielded reliable evidence of ORF2p peptides in biological samples.

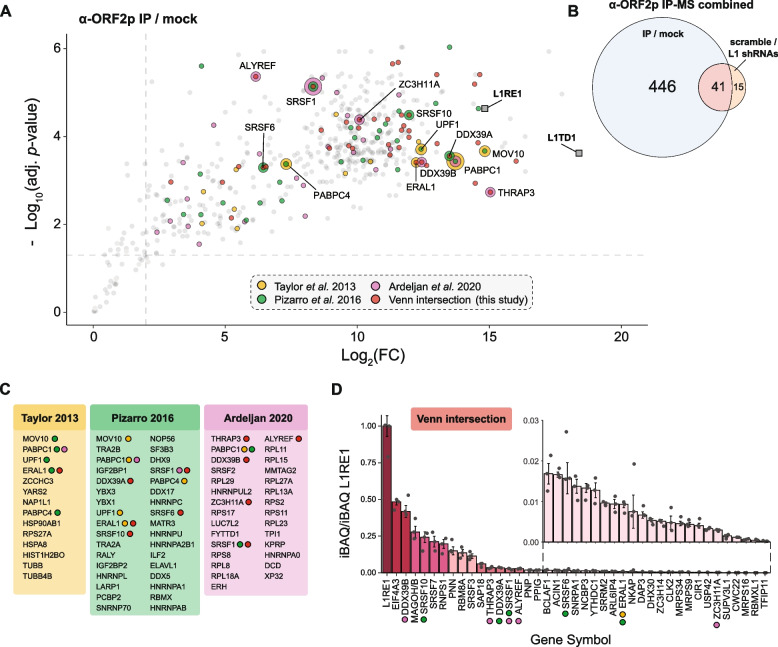
Results: Here we present targeted mass spectrometry assays, selected and parallel reaction monitoring (SRM and PRM, respectively) to detect and quantify L1 ORF1p and ORF2p at their endogenous abundances. We were able to quantify ORF1p and ORF2p present in our samples down to a range in the low attomoles. Confident in our ability to affinity enrich ORF2p, we describe an interactome associated with endogenous ORF2-containing macromolecular assemblies.

Conclusions: This is the first assay to demonstrate sensitive and robust quantitation of endogenous ORF2p. The ability to assay ORF2p directly and quantitatively will improve our understanding of the developmental and diseased cell states where L1 expression and its activity naturally occur. The ability to simultaneously assay endogenous L1 ORF1p and ORF2p is an important step forward for L1 analytical biochemistry. Endogenous ORF2p interactomes can now be presented with confidence that ORF2p is among the enriched proteins.

Keywords: Cancer; LINE-1; Mass spectrometry; PRM; Retrotransposon; SRM; Targeted proteomics.


Conflict of interest statement

Declarations. Ethics approval and consent to participate: Fresh frozen tissues were collected at Massachusetts General Hospital Department of Pathology as de-identified patient samples in accordance with Exemption 4, of research involving human subjects, from the National Institutes of Health. These samples were subsequently analyzed at The Rockefeller University, where, according to 45 CFR 46.102 (f) of the U.S. Dept. of Health and Human Services, it was determined that this research does not involve human subjects (IRB reference #334332). Consent for publication: Not applicable. Competing interests: JL reports grants, personal fees, and equity from Rome Therapeutics, outside the submitted work. MT reports personal fees, and equity from Rome Therapeutics, outside the submitted work. JL, MIN, and JCW have a patent application pending, based on this work. The other authors declare no competing interests.

Figures

Fig. 1
Fig. 1
Robust ORF2p signals are absent from IP-western blotting. A This panel was modified from [24]: ⍺-ORF1p IPs were performed on HEK293T cells ectopically expressing L1RP (⍺-ORF1p pMT302), a metastatic sigmoid colon cancer tissue resected from liver (⍺-ORF1p T), and controls (mIgG T: mock IP with naïve mouse polyclonal IgG; ⍺-ORF1p N: IP using matched normal tissue). The eluted proteins were probed for the presence of ORF1p (clone 4H1) and ORF2p (clone 9) by western blotting (all samples shown were probed on the same blot). The duration of the image data collection (in min, to the ECL reaction), the CCD imager sensitivity setting (high sensitivity), and whether the panel was tone-adjusted in the figure, are given (see Methods). B This panel displays ORF2p IP-western blot trials to assay the detectability of endogenous ORF2p by direct IP by this method. Enrichment of endogenous ORF2p was attempted using ⍺-ORF2p (clone 9) in two embryonal carcinoma cell lines (N2102Ep clone 2/A6 and NTERA-2 clone D1). As a negative control, naïve rabbit IgG was used for IP (rIgG; N2102Ep). As a positive control ⍺-ORF1p (4H1) was used for IP (ectopic L1 expression in HEK293TLD from pMT302 [33] which carries ORF2p::3xFLAG). For detection of ORF2p, two different ⍺-ORF2p antibodies targeting distinct epitopes were used (clone 5 [left]; clone 11 [right] [24]). For detection of ORF1p, 4H1 was used (as in panel A). ORF2p IPs demonstrated several features that raised doubts about the reliability of the potential ORF2p signal at ~ 150 kDa
Fig. 2
Fig. 2
PRM analysis of ORF2p and ORF1p. A rORF2p (n = 2) and ⍺-ORF2p-IPs (ectopically expressed L1 RNPs; n = 3) were digested with trypsin and all detectable peptides from both samples were analyzed using PRM (targeted precursor m/z values and resulting fragment ions are listed in Supp. Table 6). LEFT: all ORF2p peptides are listed from N-terminal (top) to C-terminal (bottom) and colored based on protein domains [49]. Peptide LC retention times are plotted based on peak LC retention times from all sample replicates, using a 90-min gradient from 3–29% solvent B (see Methods). Peptide signals are plotted as either summed MS1 precursor peak area from three isotopologues, or summed MS2 peak area from the five most intense fragment ions. Peak areas are represented as % of maximum area observed within each replicate. B ⍺-ORF2p co-IPs of ORF1p (within L1 RNPs, as in panel A; n = 3) were digested with trypsin and all detectable peptides were analyzed using PRM (targeted precursor m/z values and used fragment ions are listed in Supp. Table 6). The figure layout as in panel A
Fig. 3
Fig. 3
Detection of ORF2p in immunoprecipitates using targeted MS methods. A Domain structure diagram of ORF1p and ORF2p. The position of the reporter peptides used in the targeted MS assays are highlighted below the diagrams (ORF1p: NLEECITR & LSFISEGEIK; ORF2p: QVLSDLQR & IFATYSSDK). The ⍺-ORF2p cl. 9 epitope is also highlighted below the ORF2p structure. B Detection of L1 peptides in N2102Ep cells using SRM. ORF1p peptides are detected both directly in cell lysates (left) and in ⍺-ORF2p-IP (right), while ORF2p peptides are only detected following ⍺-ORF2p-IP. Each diagram shows the summed signal of the top-3 fragments from both endogenous peptides (red) and from spike-in of heavy-labeled peptides (blue). The signal from heavy ORF1p peptides corresponds to 1 fmol, and 0.1 fmol for heavy ORF2p peptides. Recorded fragment MS intensities are shown on the y-axis and peptide retention time in minutes are shown on the x-axis. C Detection of L1 peptides in N2102Ep cells using PRM. Each diagram shows the summed signal of the top-5 (ORF1p) or top-4 (ORF2p) fragments from both endogenous peptides (red) and from spike-in of heavy-labeled peptides (blue). The signal from heavy ORF1p peptides corresponds to 1 fmol, and 0.2 fmol for heavy ORF2p peptides. Recorded fragment MS intensities are shown on the y-axis and peptide retention time in minutes are shown on the x-axis. D Summary table of results collected for N2102Ep ⍺-ORF2p-IPs using either SRM (n = 2) or PRM (n = 2). E ORF1p (upper panel) and ORF2p (lower panel) peptide levels detected using PRM-MS in N2102Ep WT cells or cells transfected with either L1-targeting shRNA (shRNA #1 and shRNA #2) or a non-targeting shRNA scramble control. Peptide levels are shown as percent of WT average (n = 2). ND: not detected
Fig. 4
Fig. 4
Detection of ORF2p in immunoprecipitates from human cancers. A ⍺-ORF1p western blotting of ⍺-ORF1p IPs from N2102Ep WT cells, L1 KD cells, and selected tumors (T) with matched healthy control tissues (H). B Table summarizing the quantities of ORF2p (IP-PRM of peptide QVLSDLQR) present in the samples that were blotted in panel (A). The ‘% Inject’ column lists the percentage of the sample that was injected into the MS instrument. The ‘Protein Input’ column shows the quantity of total protein used as input for the ⍺-ORF2p IPs. The last column shows the detected amount (in amol) of ORF2p adjusted for % injected and the amount of total protein used as the input for the IP. C PRM quantitation of ORF2p (peptide QVLSDLQR) in ⍺-ORF2p-IPs from an ovarian malignant mixed Mullerian tumor (MMMT). The detected levels (in amol) of the peptide, QVLSDLQR, were measured using 10% of ⍺-ORF2p-IPs from both N2102Ep cells (n = 2) and from the ovarian MMMT patient sample (n = 3). In panels C-F, the top-4 fragments from both the endogenous peptide (red) and spiked-in, heavy-labeled peptide (blue) are shown; the heavy peptide corresponds to 200 amol. D PRM quantitation of ORF2p in ⍺-ORF2p-IPs from a metastatic colon adenocarcinoma (colon AC) resected from the liver. Healthy control tissue corresponds to non-cancerous liver tissue resected together with the cancer. The detected levels (in amol) of the ORF2p peptide where measured in a 20% sample injection from ⍺-ORF2p-IPs from either healthy liver tissue (n = 3) or metastatic colon adenocarcinoma (n = 3). E PRM quantitation of ORF2p in ⍺-ORF2p-IPs from a high-grade serous ovarian carcinoma (HGSOC) tumor. Healthy control tissue corresponds to non-cancerous spleen tissue resected together with the cancer. The detected levels of the peptide were measured using 20% of ⍺-ORF2p-IPs from either healthy liver tissue (n = 3) or metastatic colon adenocarcinoma (n = 3). F PRM quantitation of ORF2p in ⍺-ORF2p-IPs from a sigmoid colon adenocarcinoma. Healthy control tissue corresponds to adjacent non-cancerous colon tissue resected together with the cancer. The detected levels of ORF2p were measured of ⍺-ORF2p-IPs from either healthy liver tissue (n = 3) or metastatic colon adenocarcinoma (n = 3). In panels (D-F), ND: not detected
Fig. 5
Fig. 5
L1 ORF2p interactome in N2102Ep cells. A The plot displays a one-tailed t-test comparing proteins obtained from label-free quantitative shotgun IP-MS (⍺-ORF2p IP / mock IP; x-axis: log2 fold change; y-axis: -log10 adjusted p-value). Subsets of significant proteins are colored according to their overlap with at least one selected prior published list (described in the legend [12, 24, 33]) and/or their correspondence with a second label-free quantitative shotgun IP-MS analysis from this study (⍺-ORF2p IP scramble shRNA / ⍺-ORF2p IP L1-targeting shRNAs; overlap displayed in panels B and D). Proteins that are labeled with text (cognate UniProt gene symbol) correspond with at least two of these lists and display multiple colors accordingly. L1RE1 and L1TD1 are both marked as gray squares. B Venn diagram showing the number of significant proteins obtained by label-free quantitative shotgun IP-MS: ⍺-ORF2p IP / mock IP (DDA) & ⍺-ORF2p scramble shRNA / ⍺-ORF2p L1-targeting shRNAs (DIA; see Methods). C Lists of proteins that were considered significant in prior publications (as labeled) that also overlap with this study. When a protein was considered significant in multiple prior studies and in this study, colored dots indicate the overlap according to the legend shown in panel A. Note: the significant proteins listed from ‘Pizarro 2016’ were collated and summarized data from two prior publications [59, 60]). D The plot displays the estimated copy number, relative to L1RE1 (L1 ORF1p), of each of the intersecting 41 proteins in common between the two different IP-MS analyses in this study (panel B). Relative copy number was calculated using the iBAQ values [61] for the proteins listed

Similar articles

References

    1. Feng Q, Moran JV, Kazazian HH, Boeke JD. Human L1 retrotransposon encodes a conserved endonuclease required for retrotransposition. Cell. 1996;87:905–16. - PubMed
    1. Mathias SL, Scott AF, Kazazian HH, Boeke JD, Gabriel A. Reverse transcriptase encoded by a human transposable element. Science. 1991;254:1808–10. - PubMed
    1. Ostertag EM, Kazazian HH. Biology of mammalian L1 retrotransposons. Annu Rev Genet. 2001;35:501–38. - PubMed
    1. Beck CR, Collier P, Macfarlane C, Malig M, Kidd JM, Eichler EE, et al. LINE-1 retrotransposition activity in human genomes. Cell. 2010;141:1159–70. - PMC - PubMed
    1. Malik HS, Burke WD, Eickbush TH. The age and evolution of non-LTR retrotransposable elements. Mol Biol Evol. 1999;16:793–805. - PubMed

LinkOut - more resources