MEPs and MRI Motor Band Sign as Potential Complementary Markers of Upper Motor Neuron Involvement in Amyotrophic Lateral Sclerosis
- PMID: 39916336
- PMCID: PMC11802645
- DOI: 10.1111/ene.70055
MEPs and MRI Motor Band Sign as Potential Complementary Markers of Upper Motor Neuron Involvement in Amyotrophic Lateral Sclerosis
Abstract
Background: Amyotrophic lateral sclerosis (ALS) is characterized by the degeneration of both upper and lower motor neurons (UMNs and LMNs). Recognizing the involvement of UMNs is challenging because of the absence of reliable biomarkers beyond clinical evaluation.
Aim: To identify a reliable marker of UMN damage in a cohort of patients with ALS referring to the Motor Neuron Disease Clinic of the University Hospital of Padova.
Methods: We retrospectively evaluated the clinical records of 79 patients with ALS and compared the results of various investigations, including the motor-evoked potentials (MEPs), positron emission tomography-magnetic resonance imaging (MRI) and light neurofilaments (NfLs), with the degree of UMN clinical involvement, as assessed by the Penn Upper Motor Neuron Score (PUMNS).
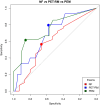
Results: MEPs, considering the central motor conduction time (CMCT) values in both the upper and lower limbs, showed a significant correlation with the relative PUMNS subscores (p = 0.01, ρ = 0.4; and p = 0.005, ρ = 0.45, respectively). Additionally, there was a positive correlation between NfLs and PUMNS values (p = 0.04, ρ = 0.33). The presence of the motor band sign on MRI was associated with higher PUMNS values. Receiver operating characteristic analysis revealed that PUMNS accurately predicted abnormalities in CMCT values (specificity 86%, sensitivity 62%) and the presence of the motor band sign (specificity 58%, sensitivity 80%).
Interpretation: In our cohort of patients with ALS, CMCT values proved to be the most reliable test for assessing UMN involvement, albeit the presence of the motor band sign on MRI showed higher sensitivity.
Keywords: ALS; PET‐MR; PUMNS; upper motor neuron.
© 2025 The Author(s). European Journal of Neurology published by John Wiley & Sons Ltd on behalf of European Academy of Neurology.
Conflict of interest statement
The authors declare no conflicts of interest.
Figures


References
-
- Hardiman O., Al‐Chalabi A., Chio A., et al., “Amyotrophic Lateral Sclerosis,” Nature Reviews. Disease Primers 3 (2017): 17071. - PubMed
-
- Al‐Chalabi A. and Hardiman O., “The Epidemiology of ALS: A Conspiracy of Genes, Environment and Time,” Nature Reviews. Neurology 9 (2013): 617–628. - PubMed
-
- Shefner J. M., al‐Chalabi A., Baker M. R., et al., “A Proposal for New Diagnostic Criteria for ALS,” Clinical Neurophysiology 131 (2020): 1975–1978. - PubMed
-
- Swash M., “Why Are Upper Motor Neuron Signs Difficult to Elicit in Amyotrophic Lateral Sclerosis?,” Journal of Neurology, Neurosurgery, and Psychiatry 83 (2012): 659–662. - PubMed
-
- Huynh W., Simon N. G., Grosskreutz J., Turner M. R., Vucic S., and Kiernan M. C., “Assessment of the Upper Motor Neuron in Amyotrophic Lateral Sclerosis,” Clinical Neurophysiology 127 (2016): 2643–2660. - PubMed
MeSH terms
Grants and funding
LinkOut - more resources
Full Text Sources
Medical
Miscellaneous

