. 2025 Jan 23:13:1511129.
doi: 10.3389/fpubh.2025.1511129. eCollection 2025.

What factors influence the willingness and intensity of regular mobile physical activity?- A machine learning analysis based on a sample of 290 cities in China

Affiliations

What factors influence the willingness and intensity of regular mobile physical activity?- A machine learning analysis based on a sample of 290 cities in China

Hao Shen et al. Front Public Health. .

Abstract

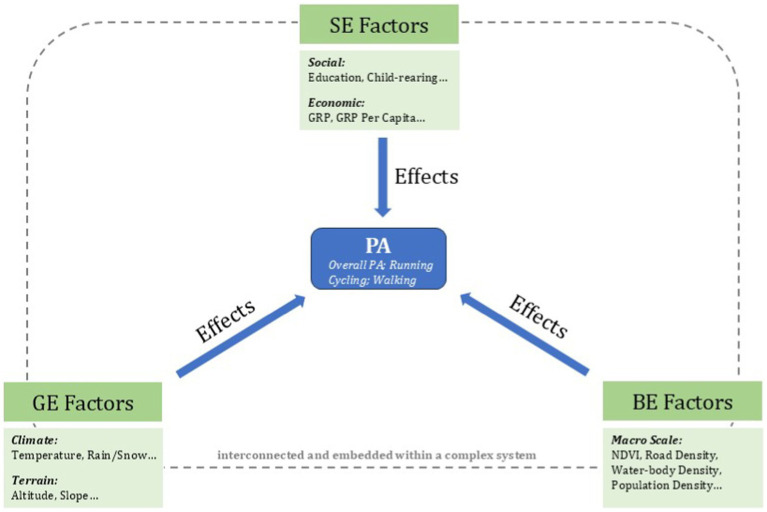
Introduction: This study, based on Volunteered Geographic Information (VGI) and multi-source data, aims to construct an interpretable macro-scale analytical framework to explore the factors influencing urban physical activities. Using 290 prefecture-level cities in China as samples, it investigates the impact of socioeconomic, geographical, and built environment factors on both overall physical activity levels and specific types of mobile physical activities.

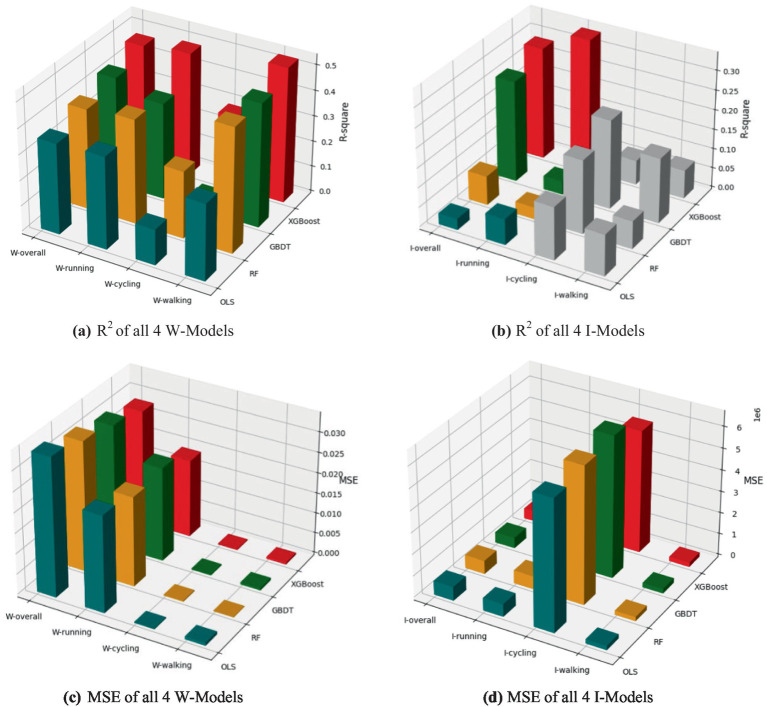
Methods: Machine learning methods were employed to analyze the data systematically. Socioeconomic, geographical, and built environment indicators were used as explanatory variables to examine their influence on activity willingness and activity intensity across different types of physical activities (e.g., running, walking, cycling). Interaction effects and non-linear patterns were also assessed.

Results: The study identified three key findings: (1) A significant difference exists between the influencing factors of activity willingness and activity intensity. Socioeconomic factors primarily drive activity willingness, whereas geographical and built environment factors have a stronger influence on activity intensity. (2) The effects of influencing factors vary significantly by activity type. Low-threshold activities (e.g., walking) tend to amplify both promotional and inhibitory effects of the factors. (3) Some influencing factors display typical non-linear effects, consistent with findings from micro-scale studies.

Discussion: The findings provide comprehensive theoretical support for understanding and optimizing physical activity among urban residents. Based on these results, the study proposes guideline-based macro-level intervention strategies aimed at improving urban physical activity through effective public resource allocation. These strategies can assist policymakers in developing more scientific and targeted approaches to promote physical activity.

Keywords: built environmental factors; geographical environmental factors; machine learning; mechanisms of influence; physical activity; socioeconomic factors; willingness and intensity.


Conflict of interest statement

The authors declare that the research was conducted in the absence of any commercial or financial relationships that could be construed as a potential conflict of interest.

Figures

Figure 1
Figure 1
Theoretical framework of this work.
Figure 2
Figure 2
The proposed analytical framework in this work.
Figure 3
Figure 3
The study area of this work (taking Chengdu as an example shows the study area of every sample city): (A) 290 sample cities in China; (B) The districts and county-level cities of Chengdu; (C) Built-up area in the districts of Chengdu.
Figure 4
Figure 4
Performance comparison of different models. (a) R2 of all 4 W-Models; (b) R² of all 4 I-Models; (c) MSE of all 4 W-Models; (d) MSE of all 4 I-Models. The gray portions in the bar chart indicate that the model’s R2 is negative.
Figure 5
Figure 5
Variables’ importance and ranks of all the models.
Figure 6
Figure 6
Variables’ SHAP values of all the models. SHAP plots show how an increase or decrease in a specific feature impacts the result (promotive or inhibitory): (1) The X-axis in the image represents the SHAP value of a specific feature (e.g., GRP) for each sample: the magnitude indicates the level of contribution; while the direction—positive or negative—indicates whether the effect is promotive or inhibitory. (2) The color of each sample point represents the actual value of the feature: Red indicates higher actual values; Blue indicates lower actual values.
Figure 7
Figure 7
Nonlinear effects of variables in the overall model: (A) NDVI (NDVI_value represents the actual NDVI value of each sample; NDVI represents the shapley value of NDVI for each sample.); (B) Pop_Den (Pop_Den_value represents the actual population density value of each sample; Pop_Den represents the shapley value of population density for each sample).
Figure 8
Figure 8
NDVI contribution distribution under the GRP perspective. The X-axis represents the Shapley values of NDVI for the samples, where the magnitude of the Shapley value indicates the contribution level of NDVI to PA for the sample, and the sign (positive or negative) indicates whether the NDVI level promotes or inhibits PA. The Y-axis represents the frequency of samples appearing within the corresponding X-axis intervals.
Figure 9
Figure 9
NDVI contribution distribution under the AL perspective. The X-axis represents the Shapley values of NDVI for the samples, where the magnitude of the Shapley value indicates the contribution level of NDVI to PA for the sample, and the sign (positive or negative) indicates whether the NDVI level promotes or inhibits PA. The Y-axis represents the frequency of samples appearing within the corresponding X-axis intervals.
Figure 10
Figure 10
The distribution relationship between GRP and AL values.

References

    1. Peng B, Ng JYY, Ha AS. Barriers and facilitators to physical activity for young adult women: a systematic review and thematic synthesis of qualitative literature. Int J Behav Nutr Phys Act. (2023) 20:23. doi: 10.1186/s12966-023-01411-7, PMID: - DOI - PMC - PubMed
    1. Kohl HW, Craig CL, Lambert EV, Inoue S, Alkandari JR, Leetongin G, et al. . The pandemic of physical inactivity: global action for public health. Lancet. (2012) 380:294–305. doi: 10.1016/S0140-6736(12)60898-8, PMID: - DOI - PubMed
    1. Strain T, Flaxman S, Guthold R, Semenova E, Cowan M, Riley LM, et al. . National, regional, and global trends in insufficient physical activity among adults from 2000 to 2022: a pooled analysis of 507 population-based surveys with 5·7 million participants. Lancet Glob Health. (2024) 12:e1232–43. doi: 10.1016/S2214-109X(24)00150-5, PMID: - DOI - PMC - PubMed
    1. Rhodes RE, Janssen I, Bredin SSD, Warburton DER, Bauman A. Physical activity: health impact, prevalence, correlates and interventions. Psychol Health. (2017) 32:942–75. doi: 10.1080/08870446.2017.1325486, PMID: - DOI - PubMed
    1. Wang Y, Steenbergen B, van der Krabben E, Kooij H-J, Raaphorst K, Hoekman R. The impact of the built environment and social environment on physical activity: a scoping review. Int J Environ Res Public Health. (2023) 20:6189. doi: 10.3390/ijerph20126189, PMID: - DOI - PMC - PubMed