. 2025 May 13;151(19):1391-1408.
doi: 10.1161/CIRCULATIONAHA.124.072384. Epub 2025 Feb 7.

Ezh2 Shapes T Cell Plasticity to Drive Atherosclerosis

Affiliations

Ezh2 Shapes T Cell Plasticity to Drive Atherosclerosis

Cecilia Assunta Bonfiglio et al. Circulation. .

Abstract

Background: The activation and polarization of T cells play a crucial role in atherosclerosis and dictate athero-inflammation. The epigenetic enzyme EZH2 (enhancer of zeste homolog 2) mediates the H3K27me3 (trimethylation of histone H3 lysine 27) and is pivotal in controlling T cell responses.

Methods: To detail the role of T cell EZH2 in atherosclerosis, we used human carotid endarterectomy specimens to reveal plaque expression and geography of EZH2. Atherosclerosis-prone Apoe (apolipoprotein E)-deficient mice with CD (cluster of differentiation) 4+ or CD8+ T cell-specific Ezh2 deletion (Ezh2cd4-knockout [KO], Ezh2cd8-KO) were analyzed to unravel the role of T cell Ezh2 in atherosclerosis and T cell-associated immune status.

Results: EZH2 expression is elevated in advanced human atherosclerotic plaques and primarily expressed in the T cell nucleus, suggesting the importance of canonical EZH2 function in atherosclerosis. Ezh2cd4-KO, but not Ezh2cd8-KO, mice showed reduced atherosclerosis with fewer advanced plaques, which contained less collagen and macrophages, indicating that Ezh2 in CD4+ T cells drives atherosclerosis. In-depth analysis of CD4+ T cells of Ezh2cd4-KO mice revealed that absence of Ezh2 results in a type 2 immune response with increased Il-4 (interleukin 4) gene and protein expression in the aorta and lymphoid organs. In vitro, Ezh2-deficient T cells polarized macrophages toward an anti-inflammatory phenotype. Single-cell RNA-sequencing of splenic T cells revealed that Ezh2 deficiency reduced naive, Ccl5+ (C-C motif chemokine ligand 5) and regulatory T cell populations and increased the frequencies of memory T cells and invariant natural killer T (iNKT) cells. Flow cytometric analysis identified a shift toward Th2 (type 2 T helper) effector CD4+ T cells in Ezh2cd4-KO mice and confirmed a profound increase in splenic iNKT cells with increased expression of Plzf (promyelocytic leukemia zinc finger), which is the characteristic marker of the iNKT2 subset. Likewise, Zbtb16 ([zinc finger and BTB domain containing 16], the Plzf-encoding gene) transcripts were elevated in the aorta of Ezh2cd4-KO mice, suggesting an accumulation of iNKT2 cells in the plaque. H3K27me3-chromatin immunoprecipitation followed by quantitative polymerase chain reaction showed that T cell-Ezh2 regulates the transcription of the Il-4 and Zbtb16 genes.

Conclusions: Our study uncovers the importance of T cell EZH2 in human and mouse atherosclerosis. Inhibition of Ezh2 in CD4+ T cells drives type 2 immune responses, resulting in an accumulation of iNKT2 and Th2 cells, memory T cells and anti-inflammatory macrophages that limit the progression of atherosclerosis.

Keywords: EZH2; T-lymphocytes; atherosclerosis; epigenomics; natural killer T cells.


Conflict of interest statement

None.

Figures

Figure 1.
Figure 1.
EZH2 expression is increased in human atherosclerotic carotid plaques and is predominantly present in plaque T cells. A, Representative images and hematoxylin and eosin staining (scale bar=2 mm) and EZH2 (enhancer of zeste homolog 2) expression in advanced atherosclerotic plaques vs early lesions from bulk RNA-sequencing data of human carotid endarterectomy (CEA) samples of the Munich Vascular Biobank (n=56 vs 147). Data are presented as mean±SD and analyzed using a 2-tailed Mann-Whitney U test. B through D, Single-cell gene expression data were retrieved from a published data set of carotid atherosclerotic plaques from 18 patients who underwent CEA (GSE253904). B, Clusters of individual plaque T cells (CD4, CD8, Treg, and EZH2+ cell subclusters), NK cells, B cells, plasma cells, dendritic cells (myeloid [mDCs] and plasmacytoid [pDCs]), neutrophils, mast cells, macrophages, endothelial cells (EC), and vascular smooth muscle cells (VSMC) visualized using the Uniform Manifold Approximation and Projection (UMAP). The cluster-defining genes are depicted in Figure S1C. C, Expression pattern of EZH2 in individual cell clusters visualized in the UMAP. D, Dot plot depicting the relative expression of EZH2 in each identified cell cluster from C. E, Zoom-in on the natural killer (NK) and T cell clusters in B with a dot plot showing the marker genes characterizing the 5 major subclusters. Color from white to purple in C through E represents average gene expression, whereas the dot size in D and E reflects the percentage of cells expressing the gene in each cluster. CD3D indicates CD3 delta subunit of T cell receptor complex; CD4, CD4 molecule; CD8A, CD8 subunit alpha; CD8B, CD8 subunit beta; CTLA4, cytotoxic T-lymphocyte associated protein 4; EZH2, enhancer of zeste homolog 2; FOXP3, forkhead box P3; GZMB, granzyme B; GZMK, granzyme K; IL2RA, interleukin 2 receptor subunit alpha; IL7R, interleukin 7 receptor; KLRD1, killer cell lectin like receptor D1; KLRF1, killer cell lectin like receptor F1; MKI67, marker of proliferation Ki-67; PRF1, perforin 1; TNFRSF18, TNF receptor superfamily member 18; TOP2A, topoisomerase II alpha; TRAC, T cell receptor alpha constant; and TYMS, thymidylate synthetase.
Figure 2.
Figure 2.
T cell–specific Ezh2 deficiency reduces plaque burden and determines fewer advanced plaques. A, Atherosclerotic plaque area at indicated positions across the aortic root in female Ezh2cd4-WT and Ezh2cd4-KO mice (n=8 vs 10) (left) with representative Oil Red O–stained images (right), scale bar: 100 µm. B, Atherosclerotic plaques classified by phenotype (initial and advanced plaques; n=24 lesions from 8 vs 8 animals) and representative hematoxylin and eosin–stained images (scale bar=100 µm). C through E, Histological and immunofluorescent quantification of collagen content through Sirius red analysis (C; n=8 vs 8), macrophage (Mac3+) area (D; n=8 vs 7), and αSMA (α-smooth muscle cell actin) content (E; n=8 vs 7) in cross-sections of the aortic root with representative images (scale bar=100 µm). F and G, Immunofluorescent staining assessing CD4+ and Foxp3+ cells in cross-sections of aortic roots with representative images (n=9 vs 10; scale bar=100 µm). Data are represented as mean±SD; comparisons were assessed by 2-tailed Student t test (A, C, and F), Fisher exact test (B), or 2-tailed Mann-Whitney U test (D, E, and G). For quantitative immunohistochemistry experiments, cohorts included 8 WT and 11 KO mice. Because of occasional section damage and folding, some samples had to be eliminated for some comparisons. Ezh2 indicates enhancer of zeste homolog 2; Foxp3, forkhead box protein 3; KO, knockout; Mac3, macrophage surface protein, and WT, wild type.
Figure 3.
Figure 3.
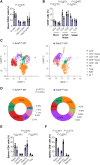
T cell-specific Ezh2 deficiency shifts T cell populations from naive to memory, effector and iNKT cell subsets. A, Flow cytometric (FC) analysis of major blood immune cell populations in atherosclerotic Ezh2cd4-WT and Ezh2cd4-KO mice (n=9 vs 10). B, FC analysis of the CD4+ and CD8+ subsets in the blood, lymph nodes (LN), and spleen (n=9 vs 10). C and D, Single-cell transcriptomes of splenic CD3+ cells isolated from atherosclerotic Ezh2cd4-WT and Ezh2cd4-KO mice (n=4 vs 4). C, Uniform Manifold Approximation and Projection (UMAP) visualization of cell clusters of individual CD3+ cell subsets in spleens from Ezh2cd4-WT and Ezh2cd4-KO mice. Cell clusters were annotated using cell-type specific marker genes, as depicted in Figure S4A. D, Doughnut chart visualizing the proportion of each T cell cluster identified using their single-cell transcriptome. E and F, FC analysis of splenic T cells isolated from Ezh2cd4-WT and Ezh2cd4-KO mice (n=9 vs 10). E, CD4+ naive (CD62L+, CD44-), effector memory (CD62L-, CD44+), central memory (CD62L+, CD44+), and Tregs, as well as CD8+-naive, effector memory, and central memory T cells (F). Data are represented as mean±SD. A, E, and F, Comparisons were assessed using Mann-Whitney U tests with multiple comparisons and Benjamini-Krieger-Yekutieli correction for FDR, whereas in B, the analysis was performed per organ: multiple unpaired t tests for blood and multiple Mann-Whitney U tests for lymph nodes and spleen with multiple comparisons and Benjamini-Krieger-Yekutieli correction for FDR, for all the 3 organs. D, Comparisons were assessed with χ² test and post hoc Z tests corrected for Bonferroni. CD indicates cluster of differentiation; CD4em, CD4 effector memory; CD62L, CD62 antigen-like family member; CD8cm, CD8 central memory; Ezh2, enhancer of zeste homolog 2; Foxp3, forkhead box protein 3; iNKT, invariant natural killer T cells; KO, knockout; Tfh, T follicular helper cells; Treg, regulatory T cells; and WT, wild type.
Figure 4.
Figure 4.
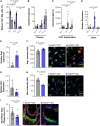
T cell–specific Ezh2 deficient mice exhibit an increase in type 2 cytokine-producing T helper cells, capable of polarizing macrophages into an anti-inflammatory state. A, Flow cytometric (FC) analysis of splenic CD4+ T cells from atherosclerotic Ezh2cd4-WT and Ezh2cd4-KO mice to identify T helper (Th) 1 (Cxcr3+/Ccr6-), Th2 (CxcrCR3-/Ccr6-) and Th17 (Cxcr3-/Ccr6+) cells (n=9 vs 10). B, Cytokine measurements from the (B) plasma (n=5-8 vs 5-7) or (C) supernatant of in vitro cultured splenic CD4+ T cells isolated from atherosclerotic Ezh2cd4-WT and Ezh2cd4-KO mice (n=7 vs 8). D, Gene expression of Ifn-γ, Il-4, and Il-13 in the descending aorta of Ezh2cd4-WT and Ezh2cd4-KO mice (n=4–7 vs 5–6) using qPCR. E through H, Macrophage phenotyping after culturing with supernatant of CD4+ T cells isolated from atherosclerotic Ezh2cd4-WT and Ezh2cd4-KO mice. E, Gene expression analysis of Arg1 ([arginase 1] n=3 vs 3). F, Immunofluorescence Arg1 (n=4 vs 4) with representative images (scale bar=25 µm). G, Gene expression analysis of inducible nitric oxide synthase ([iNos] n=3 vs 3). H, immunofluorescence staining of iNos (n=4 vs 4) with representative images (scale bar=25 µm). I, Immunofluorescent staining assessing macrophage (Mac3+) content and iNos-expressing macrophages in cross-sections of aortic roots with representative images (n=9 vs 9; scale bar=25 µm). Data are represented as mean±SD; comparisons were assessed with 2-tailed Student t test (A) and Mann-Whitney U tests (B through D) with multiple comparisons and Benjamini-Krieger-Yekutieli correction for false discovery rate, and with 2-tailed Student t test (E through I). CD indicates cluster of differentiation; Ezh2, enhancer of zeste homolog 2; KO, knockout; Mac3+, macrophage surface protein; and WT, wild type.
Figure 5.
Figure 5.
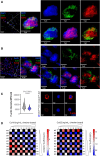
Ezh2 deficiency in CD4+ T cells epigenetically fosters the differentiation of iNKT cells. A, Differentially expressed genes (adjusted P value <0.05) in CD4+ T cells isolated from the spleen of atherosclerotic Ezh2cd4-WT and Ezh2cd4-KO mice (n=4 vs 3). Gene expression is depicted in the heatmap, the top 15 upregulated genes are highlighted in the enlarged heatmap in the inset. Volcano plot reports Padj values and fold changes as computed with edgeR. B, Enrichment analysis of upregulated genes in data sets of chromatin–immunoprecipitation (ChIP) sequencing of cells and tissues available from the epigenomics roadmap for histone modification in ENCODE. C, Pathway and process enrichment analysis for the upregulated genes in KEGG (Kyoto Encyclopedia of Genes and Genomes) pathways and Gene Ontology (GO) biological processes and molecular functions. The network of enriched terms is visualized with Cytoscape and color codes reflect the cluster IDs presented in the dot plot. D, Protein-to-protein interaction network of upregulated genes and GO enrichment analysis for the top three represented terms. The color defines the 2 densely interconnected clusters detected by Molecular Complex Detection and module components are enlisted. E, Overlap of the upregulated genes in CD4+ T cells of Ezh2cd4-KO mice and available cell-specific transcriptomic data. For each atlas, the cell type with the most significant overlap (lowest P value, assessed by χ2) is reported. F, Venn diagram showing the overlap between transcription factors (TF) significantly regulated in CD4+ T cells of Ezh2cd4-KO mice and a list of TFs specific for iNKT cell development and differentiation described in the literature. G, ChIP–quantitative polymerase chain reaction analysis (qPCR) to analyze the enrichment of H3K27me3 and IgG control in splenic CD3+ T cells at the promoter of Zbtb16 (F) and Il-4 (G) in Ezh2cd4-KO mice and respective controls (n=4 vs 4). Data are represented as mean±SD. Comparisons were assessed using 2-way ANOVA test with multiple comparisons and Benjamini-Krieger-Yekutieli correction for false discovery rate (FDR) for F and G. H, Enrichment of H3K27me3 mark in the promoter of the ZBTB16 gene in human thymus and spleen. Statistically significant peaks are noted above the read histograms. Data were retrieved from ENCODE ([Encyclopedia of DNA Elements] GSE18927 and GSE187334). Akna indicates AT-hook transcription factor; Arhgap24, rho GTPase activating protein 24; Asb2, ankyrin repeat and SOCS box-containing 2; Atp6v0d2, ATPase, H+ transporting, lysosomal V0 subunit D2; Bhlhe40, basic helix-loop-helix family, member e40; BM, bone marrow; Bts, zinc finger protein BRUTUS; CD, cluster of differentiation; Cd160, CD160 antigen; Cdk6, cyclin dependent kinase 6; Cxxc5, CXXC finger 5; DEG, differential expressed genes; E2f2, E2F transcription factor 2; Epha3, Eph receptor A3; Erg1, early growth response protein 1; Erg2, early growth response 2; Ezh2, enhancer of zeste homolog 2; Foxp3, forkhead box P3; Gh, growth hormone; Gnas, GNAS complex locus; H3K27me3, trimethylation of histone 3 lysine 27; Hif1a, hypoxia inducible factor 1, alpha subunit; Hlx, H2.0-like homeobox; IgG, Immunoglobulin G; Ikzf4, IKAROS family zinc finger 4; Il17rb, interleukin 17 receptor B; Il4, interleukin 4; iNKT, invariant natural killer T cells; Irf1, interferon regulatory factor 1; Irf7, interferon regulatory factor 7; Irf9, interferon regulatory factor 9; Jun, jun proto-oncogene; Junb, jun B proto-oncogene; Klf6, krüppel-like transcription factor 6; Klra1, killer cell lectin-like receptor, subfamily A, member 1; Klra3, killer cell lectin-like receptor, subfamily A, member 3; Klra4, killer cell lectin-like receptor, subfamily A, member 4; Klra9, killer cell lectin-like receptor subfamily A, member 9; Klrb1c, killer cell lectin-like receptor subfamily B member 1C; Klrc1, killer cell lectin-like receptor subfamily C, member 1; Klrc2, killer cell lectin-like receptor subfamily C, member 2; KO, knockout; Lef1, lymphoid enhancer binding factor 1; Mxd1, MAX dimerization protein 1; Nfil3, nuclear factor interleukin 3 regulated; Nr4a1, nuclear receptor subfamily 4, group A, member 1; Nrgn, neurogranin; Pa2g4, proliferation-associated 2G4; Phlpp2, PH domain and leucine-rich repeat protein phosphatase 2; Pou2f2 , POU domain, class 2, transcription factor 2; Rgs12, regulator of G-protein signaling 12; Rgs3, regulator of G-protein signaling 3; Rhoq, ras homolog family member Q; Sap, SLAM-associated protein; Slamf6, SLAM family member 6; Sp2, Sp2 transcription factor; Stat1, signal transducer and activator of transcription 1; Stat3, signal transducer and activator of transcription 3; Stat6, signal transducer and activator of transcription 6; Syde1, synapse defective 1, Rho GTPase, homolog 1; Tcrg-C2, T Cell Receptor Gamma Constant 2; Thap3, THAP domain containing, apoptosis-associated protein 3; Tspan9 , tetraspanin 9; Vdr, vitamin D (1,25-dihydroxyvitamin D3) receptor; WT, wild type; Zbtb16, zinc finger and BTB domain containing 16; Zbtb32, zinc finger and BTB domain containing 32; Zbtb7b, zinc finger and BTB domain containing 7B; and Zfp536, zinc finger protein 536.
Figure 6.
Figure 6.
Accumulation of iNKT2 cells in Ezh2cd4-KO mice. A, Flow cytometric (FC) analysis of splenic iNKT cells (CD1d+TCRb+) from atherosclerotic Ezh2cd4-WT and Ezh2cd4-KO mice (n=12 vs 8). B, Representative FC histogram displaying the comparison of Plzf (promyelocytic leukemia zinc finger) protein expression in iNKT cells from both mouse strains and fluorescence minus one (FMO) control. C, Splenic iNKT comparison between Ezh2cd4-WT and Ezh2cd4-KO mice and classification into iNKT1 (Plzflow), iNKT2 (Plzfhigh), and iNKT17 (Plzfinterm; RORγt+) subsets (n=5 vs 6). D, Gene expression of Zbtb16 in the descending aorta of atherosclerotic Ezh2cd4-WT and Ezh2cd4-KO mice measured by quantitative polymerase chain reaction (n=7 vs 7). E, ZBTB16 expression in advanced atherosclerotic plaques vs early lesions from bulk RNA-sequencing data of human carotid endarterectomy (CEA) samples of the Munich Vascular Biobank. F, Bivariate correlation between ZBTB16 (y-axis) and EZH2 (x-axis) in human atherosclerotic plaques from the Munich Vascular Biobank visualized as a linear regression line with 95% CI. Data are represented as mean±SD; comparisons were assessed by 2-tailed Student t test with Welch’s correction (A), χ2 distribution analysis (C), 2-tailed Mann-Whitney U test (D and E), and Spearman correlation test (F). APC indicates allophycocyanin; CD, cluster of differentiation; Ezh2, enhancer of zeste homolog 2; iNKT, invariant natural killer T cells; KO, knockout; RORγt, retinoic acid–related orphan receptor γt; TCRb, T cell receptor ß; WT, wild type; and ZBTB16, zinc finger and BTB domain containing 16.
Figure 7.
Figure 7.
Thymic iNKT2 cells in Ezh2cd4-KO mice initiate the type 2 immune response. A, Flow cytometric (FC) analysis of thymic CD3+ T cells from atherosclerotic Ezh2cd4-WT and Ezh2cd4-KO mice (n=5 vs 6). B, FC analysis of thymocytes from atherosclerotic Ezh2cd4-WT and Ezh2cd4-KO mice to identify double negative (DN) and double positive (DP) subsets (n=6 vs 6-8). C, Proportion of DN subsets was determined based on CD44 and CD25 expression. DN1 (CD44+/CD25-), DN2 (CD44+/CD25+), DN3 (CD44-/CD25+), and DN4 (CD44-/CD25-). D, FC analysis of thymic CD4+ T and CD8+ T cells from atherosclerotic Ezh2cd4-WT and Ezh2cd4-KO mice (n=5-6 vs 6-7). E, Gene expression of Il-4, Il-5, Il-9, and Il-13 (interleukins 4, 5, 9, and 13, respectively) in the thymus of atherosclerotic Ezh2cd4-WT and Ezh2cd4-KO mice (n=5 vs 6). F, FC analysis of thymic iNKT cells (CD1d+TCRb+) from atherosclerotic Ezh2cd4-WT and Ezh2cd4-KO mice (n= 5 vs 6). G, Comparison of thymic iNKT cells (CD1d+TCRb+) from Ezh2cd4-WT and Ezh2cd4-KO mice and subclassification into iNKT1 (Plzflow), iNKT2 (Plzfhigh) and iNKT17 (Plzfinterm, RORγt+) subsets (n=5 vs 6). Data are represented as mean±SD; comparisons were assessed by 2-tailed Mann-Whitney U test (A and F), 2-way ANOVA with multiple comparisons and Benjamini-Krieger-Yekutieli correction for false discovery rate (B through E), and χ2 distribution analysis (G). CD indicates cluster of differentiation; Ezh2, enhancer of zeste homolog 2; iNKT, invariant natural killer T cells; KO, knockout; Plzf, promyelocytic leukemia zinc finger; RORγt, retinoic acid–related orphan receptor γt; TCRb, T cell receptor ß, and WT, wild type.
Figure 8.
Figure 8.
Noncanonical functions of EZH2 in human and murine atherosclerotic disease. A and B, Representative immunofluorescent staining assessing EZH2 localization in T cells in cross-sections of human (A) and murine (B) atherosclerotic plaque. Scale bars=100 µm (overview) or 5 µm (zoom-in). C, Quantitative analysis of cellular F-actin content (n=51 vs 19 cells) together with representative F-actin, Ezh2, and DAPI (to counterstain nuclei) immunofluorescence staining of activated CD4+ T cells isolated from Ezh2cd4-KO and Ezh2cd4-WT mice. Scale bar=5 µm. Data are represented as mean±SD. Comparisons were assessed using Mann-Whitney U test. D, T cell migration of CD4+ T cells from Ezh2cd4-KO and Ezh2cd4-WT mice (n=4 vs 4). Migration assays were performed in transwell chambers in the presence and absence of the chemokines Ccl (C-C motif chemokine ligand) 19 and Ccl22 at indicated concentrations. The number of migrated cells was determined by flow cytometry, and the chemotactic index was normalized to the corresponding cell count at baseline condition (without chemokine). CD indicates cluster of differentiation; Ezh2, enhancer of zeste homolog 2; iNKT, invariant natural killer T cells; KO, knockout; MFI, mean fluorescence intensity; and WT, wild type.

Comment in

References

    1. Libby P. The changing landscape of atherosclerosis. Nature. 2021;592:524–533. doi: 10.1038/s41586-021-03392-8 - PubMed
    1. Weber C, Habenicht AJR, von Hundelshausen P. Novel mechanisms and therapeutic targets in atherosclerosis: inflammation and beyond. Eur Heart J. 2023;44:2672–2681. doi: 10.1093/eurheartj/ehad304 - PubMed
    1. de Winther MPJ, Bäck M, Evans P, Gomez D, Goncalves I, Jørgensen HF, Koenen RR, Lutgens E, Norata GD, Osto E, et al. . Translational opportunities of single-cell biology in atherosclerosis. Eur Heart J. 2023;44:1216–1230. doi: 10.1093/eurheartj/ehac686 - PMC - PubMed
    1. Engelen SE, Robinson AJB, Zurke YX, Monaco C. Therapeutic strategies targeting inflammation and immunity in atherosclerosis: how to proceed? Nat Rev Cardiol. 2022;19:522–542. doi: 10.1038/s41569-021-00668-4 - PMC - PubMed
    1. Fernandez DM, Rahman AH, Fernandez NF, Chudnovskiy A, Amir ED, Amadori L, Khan NS, Wong CK, Shamailova R, Hill CA, et al. . Single-cell immune landscape of human atherosclerotic plaques. Nat Med. 2019;25:1576–1588. doi: 10.1038/s41591-019-0590-4 - PMC - PubMed

MeSH terms

Substances