. 2025 Apr;265(4):408-421.
doi: 10.1002/path.6392. Epub 2025 Feb 7.

Comprehensive characterization of micropapillary colorectal adenocarcinoma

Affiliations

Comprehensive characterization of micropapillary colorectal adenocarcinoma

Ville K Äijälä et al. J Pathol. 2025 Apr.

Abstract

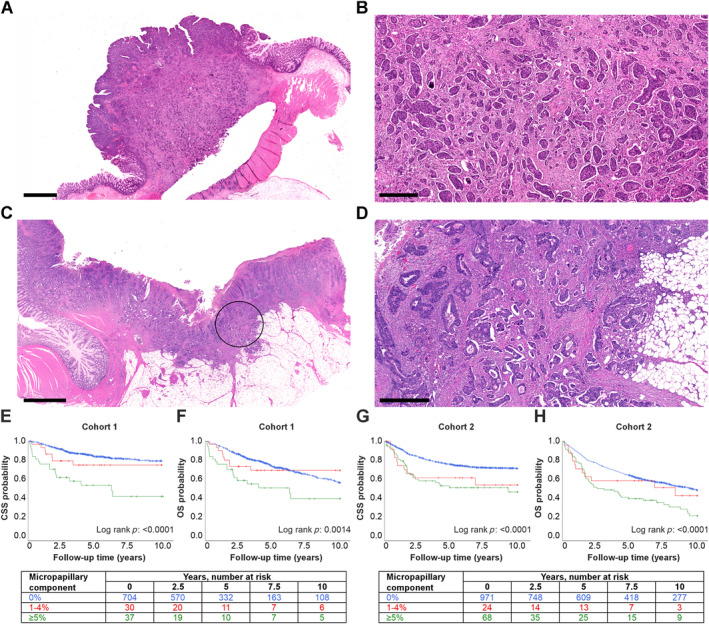
Micropapillary colorectal adenocarcinoma is a morphologic subtype of colorectal cancer (CRC) with insufficiently characterized prognostic significance and biological features. We analyzed the histopathological, immunological, and prognostic features of micropapillary adenocarcinoma in two independent CRC cohorts (N = 1,876). We found that micropapillary adenocarcinomas accounted for 4.9% and 6.4% of CRCs in the two cohorts. A micropapillary growth pattern was associated with advanced stage and lymphovascular invasion (p < 0.001), but also with shorter overall survival independent of these factors and other prognostic parameters (Cohort 1: hazard ratio [HR] 1.76, 95% confidence interval [CI] 1.08-2.87; Cohort 2: HR 1.47, 95% CI 1.08-2.00). Multiplex immunohistochemistry and machine learning-assisted image analysis showed that the micropapillary growth pattern was associated with decreased CD3+ T-cell and CD14+HLA-DR+ monocytic cell densities. Molecular features of micropapillary adenocarcinoma were studied using bioinformatic analyses in The Cancer Genome Atlas (TCGA) cohort (N = 629) and validated with optical genome mapping and immunohistochemistry. These analyses revealed that micropapillary adenocarcinomas frequently present with chromosome region 8q24 copy number gain, TP53 mutation, and overexpression of UPK2, MUC16, and epithelial-mesenchymal transition involved genes, such as L1CAM. These results indicate that micropapillary colorectal adenocarcinoma is an aggressive morphologic subtype of CRC characterized by shorter overall survival, decreased antitumorigenic immune response, and unique molecular features. Our findings support the classification of micropapillary adenocarcinoma as a distinct, high-risk subtype of CRC, which should be systematically evaluated in patient care. © 2025 The Author(s). The Journal of Pathology published by John Wiley & Sons Ltd on behalf of The Pathological Society of Great Britain and Ireland.

Keywords: bioinformatics; colorectal cancer; epithelial‐mesenchymal transition; immunology; micropapillary; multiplex immunohistochemistry; optical genome mapping; prognosis.


Figures

Figure 1
Figure 1
Histological features and Kaplan–Meier survival analyses of micropapillary colorectal adenocarcinoma. (A) A hematoxylin & eosin (H&E)‐stained section showing the micropapillary growth pattern in most of the tumor. (B) Close‐up magnification of tumor A. The growth pattern is composed of reverse polarity tumor cell clusters that are frequently surrounded by retraction artifacts. (C) An H&E‐stained section of a tumor with a smaller micropapillary component indicated by a circle. (D) Close‐up magnification of tumor C. Micropapillary structures are surrounded by tumor cells arranged in glandular structures without micropapillary features. (E and F) The association of a micropapillary component with cancer‐specific survival (E) and overall survival (F) in Cohort 1. (G and H) The association of the micropapillary component with cancer‐specific survival (G) and overall survival (H) in Cohort 2. Scale bar, 2.5 mm (A and C) and 500 μm (B and D). Abbreviations: CSS, cancer‐specific survival; OS, overall survival.
Figure 2
Figure 2
Multiplex‐immunohistochemistry panel, image analysis, and immune cell density analysis. (A–E) Example multiplex immunohistochemistry images of a micropapillary colorectal adenocarcinoma (A, C and E) and their corresponding cell maps (B, D and F) based on machine learning assisted image analyses. (G and H) Boxplots of distributions of immune cell densities in the tumor intraepithelial region (G) and tumor stroma (H) according to the micropapillary growth pattern. The analyses are based on Cohort 2: N = 1,065 for CD3+ T‐cells, macrophages, M1‐like macrophages, and M2‐like macrophages; N = 1,045 for CD14+HLA‐DR+ mature monocytic cells, CD14+HLA‐DR immature monocytic cells, CD66B+ granulocytes, and tryptase+ mast cells; N = 1,070 for CD20+CD79A+ B cells and CD20CD79A+ plasma cells. *p value <0.05, **p value <0.01, ***p value <0.001, ****p value <0.0001. Scale bars, 100 μm.
Figure 3
Figure 3
Somatic mutations and copy number alterations in micropapillary colorectal adenocarcinoma. (A) Heatmap showing mutation frequency of common colorectal cancer associated mutations in micropapillary colorectal adenocarcinomas of the TCGA cohort (N = 28), along with basic clinicopathologic features of the tumors. (B) GISTIC analysis of somatic copy number variation in micropapillary (vs. other) colorectal cancers in the TCGA cohort. The G‐score denotes the amplitude of an aberration along with its frequency across multiple samples. (C) Optical genome mapping Circos plot of a micropapillary colorectal cancer, showing copy number gain of Chr8q with concomitant loss of Chr8p. (D) Bar chart showing frequency of Chr8q24 copy number gain in micropapillary (N = 18) and nonmicropapillary (N = 17) colorectal cancers using optical genome mapping. CMS, consensus molecular subtype; CRC, colorectal cancer; FDR, false discovery rate; TMB, tumor mutational burden.
Figure 4
Figure 4
Gene expression patterns in micropapillary colorectal adenocarcinoma. (A) Gene set enrichment analysis of micropapillary (vs. other) colorectal adenocarcinoma. (B) Volcano plot of the differentially expressed genes in micropapillary colorectal adenocarcinoma. (C and D) Example tissue microarray cores of UPK2 staining with a negative sample (C) and positive sample showing cytoplasmic staining (D). (F and G) Example tissue microarray cores of L1CAM staining with a negative sample (F) and positive sample showing membranous staining (G). (I and J) Example tissue microarray cores of MUC16 (CA125) staining with a negative sample (I) and positive sample showing membranous staining (J). (E, H and K) Bar charts depicting the increased expression of UPK2 (E), L1CAM (H), and MUC16 (K) in colorectal cancers with a micropapillary component. (A) and (B) are based on the TCGA cohort (N = 629). C–K are based on Cohort 1 [N = 761 (UPK2), N = 760 (L1CAM and MUC16)]. *p value <0.05, **p value <0.01, ***p value <0.001. Scale bar, 250 μm.

References

    1. Bray F, Laversanne M, Sung H, et al. Global cancer statistics 2022: GLOBOCAN estimates of incidence and mortality worldwide for 36 cancers in 185 countries. CA Cancer J Clin 2024; 74: 229–263. - PubMed
    1. WHO Classification of Tumours Editorial Board . Digestive System Tumours (Vol. 1, 5th edn). International Agency for Research on Cancer: Lyon, 2019.
    1. Fleming M, Ravula S, Tatishchev SF, et al. Colorectal carcinoma: pathologic aspects. J Gastrointest Oncol 2012; 3: 153–173. - PMC - PubMed
    1. Hugen N, Verhoeven RH, Lemmens VE, et al. Colorectal signet‐ring cell carcinoma: benefit from adjuvant chemotherapy but a poor prognostic factor. Int J Cancer 2015; 136: 333–339. - PubMed
    1. Keum NN, Giovannucci E. Global burden of colorectal cancer: emerging trends, risk factors and prevention strategies. Nat Rev Gastroenterol Hepatol 2019; 16: 713–732. - PubMed

Publication types

Substances