. 2025 May 2;13(5):661-679.
doi: 10.1158/2326-6066.CIR-24-0103.

Selective STING Activation in Intratumoral Myeloid Cells via CCR2-Directed Antibody-Drug Conjugate TAK-500

Affiliations

Selective STING Activation in Intratumoral Myeloid Cells via CCR2-Directed Antibody-Drug Conjugate TAK-500

Vicky A Appleman et al. Cancer Immunol Res. .

Abstract

The tumor microenvironment in solid tumors contains myeloid cells that modulate local immune activity. Stimulator of IFN gene (STING) signaling activation in these myeloid cells enhances local type-I IFN production, inducing an innate immune response that mobilizes adaptive immunity and reprograms immunosuppressive myeloid populations to drive antitumor immunity. In this study, we generated TAK-500, an immune cell-directed antibody-drug conjugate, to deliver a STING agonist to CCR2+ human cells and drive enhanced antitumor activity relative to nontargeted STING agonists. Preclinically, TAK-500 triggered dose-dependent innate immune activation in vitro. In addition, a murine TAK-500 immune cell-directed antibody-drug conjugate surrogate enhanced innate and adaptive immune responses both in in vitro and murine tumor models. Spatially resolved analysis of CCR2 and immune cell markers in the tumor microenvironment of >1,000 primary human tumors showed that the CCR2 protein was predominantly expressed in intratumoral myeloid cells. Collectively, these data highlight the clinical potential of delivering a STING agonist to CCR2+ cells.


Conflict of interest statement

V.A. Appleman, M.L. Ganno, E. Rosentrater, A.E. Maldonado Lopez, M.Y. Lee, C.I. Wang, L. Dong, T. Yoneyama, K.I. Piatkov, R.C. Gregory, A. Parent, N. Lineberry, C. Arendt, and A.O. Abu-Yousif report employment and ownership of stocks/shares with Takeda. A. Matsuda, D.M. Zhang, and J. Huang report employment with Takeda. S.A. Merrigan reports other support from Pfizer outside the submitted work. H.M. Lee reports a patent for WO2020229982 pending and a patent for WO2022097117 pending. L. Dong reports holding stocks of Takeda directly or indirectly through mutual funds during the conduct of the study. T. Yoneyama reports personal fees from Takeda Development Center Americas outside the submitted work. K.I. Piatkov reports personal fees from Takeda Pharmaceuticals International Co. and other support from Takeda Pharmaceuticals International Co. outside the submitted work. R.C. Gregory reports employment with Takeda during the conduct of the study. A. Parent reports personal fees from Takeda Pharmaceuticals during the conduct of the study. N. Lineberry reports other support from Takeda Pharmaceuticals during the conduct of the study, as well as other support from Takeda Pharmaceuticals outside the submitted work. K.A. Schalper reports grants from Takeda and personal fees from Takeda during the conduct of the study, as well as personal fees from Clinica Alemana Santiago, Shattuck Labs, AstraZeneca, EMD Serono, Takeda, Torque/Repertoire Therapeutics, CSR Life Sciences, Agenus, Genmab, OnCusp, Sanofi, Parthenon Therapeutics, Bristol Myers Squibb, Roche, Molecular Templates, Merck, Dynamicure, Indaptus Therapeutics, Moderna Inc., Merus, PeerView, Physicians Education Resource, and Forefront Collaborative and grants from TESARO/GSK, Takeda, Surface Oncology, Merck, Bristol Myers Squibb, AstraZeneca, Ribon Therapeutics, Eli Lilly and Company, Boehringer Ingelheim, Roche, Akoya Biosciences, and NextPoint Therapeutics outside the submitted work. A.O. Abu-Yousif reports personal fees and other support from Takeda during the conduct of the study. No disclosures were reported by the other authors.

Figures

Figure 1.
Figure 1.
Conjugation enhances potency compared with dazostinag through selective delivery to immune cells and improved PK. A, Structure of STING agonist TAK-500. B, Receptor occupancy (RO) assessment in human (left) and murine (right) whole blood; EC50 values of 1.757 ± 0.524 and 1.386 ± 1.151 µg/mL, respectively. Data shown represent the mean of five human donors and five murine donors from a single experiment. Experiment was performed at least twice with consistent results between independent replicates. Error is calculated as SD. C,In vitro STING activation by dazostinag in THP1 cells expressing human (left) and murine (right) CCR2. Data shown represent three technical replicates for human and two technical replicates for murine samples from a single experiment. Experiment was performed at least twice with consistent results between independent replicates. Error is calculated as SD. D, PK assessment of mTAK-500 in the plasma (left) and tumors (right) of MC38 tumor–bearing mice. Data shown represent three mice per group per timepoint. Error is calculated as SD.
Figure 2.
Figure 2.
TAK-500 drives activation of monocytes and induces type-I IFN response in vitro.A, Evaluation of classical monocyte frequency (left), monocyte activation (middle), and CCR2 expression (right) in PBMCs treated with TAK-500 for 24 hours. Data shown indicate the results of five human donors from a single experiment. Experiment was performed at least twice with consistent results between independent replicates. B, Cytokine induction in human whole blood after treatment with TAK-500 for 24 hours. Data shown represent the mean of nine human donors from a single experiment. Experiment was performed at least twice with consistent results between independent replicates. Error is calculated as SD. P value relative to vehicle control: *, ≤0.05; **, ≤0.01; ***, <0.00001.
Figure 3.
Figure 3.
mTAK-500 shows dose-dependent efficacy and induction of cytokine release in MC38 tumor–bearing mouse models. A, Antitumor effect of mTAK-500 in C57BL/6 mice bearing MC38 tumors. Data shown represent the MTVs from eight mice per group. B, Cytokine response in the plasma of MC38 tumor–bearing mice treated with mTAK-500 at 6 hours after treatment. Blue dots represent vehicle-treated animals; black dots represent mTAK-500–treated animals. Data shown represent the mean from three mice per group. For all panels, experiment was performed at least twice with consistent results between independent replicates. For all panels, error bars indicate SEM. P values relative to vehicle control: *, ≤0.05; ** ≤0.01; ***, <0.00001.
Figure 4.
Figure 4.
mTAK-500 shows dose-dependent induction of innate and adaptive immunity in an MC38 tumor–bearing mouse model. Data shown represent the mean from five mice per group per timepoint. Experiment was performed at least twice with consistent results between independent replicates. Error bars indicate SEM. A, Evaluation of monocyte frequency (left), CCR2 expression (middle), and activation (right) in the blood of MC38 tumor–bearing mice treated with mTAK-500. B, Evaluation of DC activation in the tumor-draining lymph nodes (tdLN; left and middle) and tumor (right) in MC38 tumor–bearing mice treated with mTAK-500. C, Evaluation of the frequency (left), proliferation (middle), and activation (right) of CD8+ T cells in the blood of MC38 tumor–bearing mice treated with mTAK-500. D, Evaluation of the CD8+ T-cell frequency (left) and proliferation (right) in the tumors of MC38 tumor–bearing mice treated with mTAK-500. E, Evaluation of the frequency of CD8+ T-cell proliferation in the tumors of MC38 tumor–bearing mice treated with mTAK-500. Geo, geometric.
Figure 5.
Figure 5.
mTAK-500 shows durable enhanced efficacy and increased activation of innate and adaptive immune responses when combined with anti–PD-1 or radiation. A, Antitumor effect of mTAK-500 with and without αPD-1 therapy in C57BL/6 mice bearing MC38 tumors. Data shown represent the MTVs from eight mice per group. B, Evaluation of innate and adaptive immune-cell activation in the blood, lymph nodes, and tumors of MC38 tumor–bearing mice treated with mTAK-500 with and without αPD-1. Data shown represent the mean from five mice per group per timepoint. C, Antitumor effect of mTAK-500 with and without 8 Gy of focal radiation treatment in BALB/c mice bearing CT26 tumors. Data shown represent the MTVs from eight mice per group per timepoint. D, Evaluation of innate and adaptive immune cell frequency and activation in the tumors of MC38 tumor–bearing mice treated with mTAK-500 with and without 8 Gy of focal irradiation. Data shown represent the mean for five mice per group per timepoint. For all panels, experiment was performed at least twice with consistent results between independent replicates. In all panels, error bars indicate SEM.
Figure 6.
Figure 6.
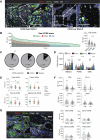
Spatially resolved and quantitative analysis of CCR2 in human NSCLC, PDAC, and CRC. A, Representative multicolor fluorescence micrographs of NSCLC cases with high (left) and low CCR2 protein expression (right). The color code for the markers is indicated within the caption. CCR2 colocalizes with CD11b/CD68 double-positive myeloid cells both within the CK+ tumor epithelium and in the surrounding stroma. Scale bar, 250 µm. B, Expression and distribution of total CCR2 protein levels (all cells) in NSCLC (green bars), PDAC (red bars), and CRC (blue bars). Each column in the histogram indicates the total CCR2 protein level in an individual tumor from the cohort. The chart on the right shows the mean levels of CCR2 protein across the three tumor types. C, Detection of CCR2 positivity in the tumor samples using the visual threshold showed a detectable signal in 94% of NSCLCs (N = 411), 89% of PDACs (N = 228), and 87% of CRCs (N = 350). D, Levels of CCR2 protein measured in the entire tumor tissue sample (total), or selectively in CK+ tumor epithelial cell areas (tumor), in CK tumor tissue areas (stroma) and in CD11b+ myeloid cells (myeloid) across NSCLC, PDAC, and CRC. E, Levels of CCR2 protein in selected tumor tissue compartments across primary lung adenocarcinomas with activating EGFR (green, n = 26) and KRAS mutations (red, n = 38) and in tumors lacking oncogenic variants in both oncogenes (gray, n = 57). Each dot in the graph represents the score in an individual tumor sample. F, Levels of CD8, PD-L1, CD11c, or XCR1 protein in primary NSCLCs with low or high CCR2 protein levels. Cases were stratified into high/low groups using the median total CCR2 protein scores. G, Representative multicolor fluorescence micrographs of CCR2, tumor, and myeloid cells in CRC cases with microsatellite instability–high (MSI-H; left) and microsatellite stable (MSS) status (right). The color code for the markers is indicated within the caption. The charts on the right show the CCR2 protein levels across the MSI-H (n = 51) and MSS (n = 282) CRC subgroups in the entire tissue area (total) or selectively measured in CK+ epithelial tumor cells (tumor), CK stromal cells (stromal), or in CD68+ TAMs. *, P < 0.05; **, P < 0.01; ***, P < 0.001; ****, P < 0.0001; ns, not significant with P > 0.05. QIF, quantitative immunofluorescence.

References

    1. Schoenfeld AJ, Hellmann MD. Acquired resistance to immune checkpoint inhibitors. Cancer Cell 2020;37:443–55. - PMC - PubMed
    1. He X, Xu C. Immune checkpoint signaling and cancer immunotherapy. Cell Res 2020;30:660–9. - PMC - PubMed
    1. Chyuan I-T, Chu C-L, Hsu P-N. Targeting the tumor microenvironment for improving therapeutic effectiveness in cancer immunotherapy: focusing on immune checkpoint inhibitors and combination therapies. Cancers (Basel) 2021;13:1188. - PMC - PubMed
    1. Ibrahim R, Saleh K, Chahine C, Khoury R, Khalife N, Cesne AL. LAG-3 inhibitors: novel immune checkpoint inhibitors changing the landscape of immunotherapy. Biomedicines 2023;11:1878. - PMC - PubMed
    1. Nagasaki J, Ishino T, Togashi Y. Mechanisms of resistance to immune checkpoint inhibitors. Cancer Sci 2022;113:3303–12. - PMC - PubMed

MeSH terms