. 2025 Feb 7;20(2):e0315171.
doi: 10.1371/journal.pone.0315171. eCollection 2025.

Impact of developmental state, p53 status, and interferon signaling on glioblastoma cell response to radiation and temozolomide treatment

Affiliations

Impact of developmental state, p53 status, and interferon signaling on glioblastoma cell response to radiation and temozolomide treatment

Artem Berezovsky et al. PLoS One. .

Abstract

Glioblastoma (GBM) tumors exhibit extensive genomic, epigenomic, and transcriptional diversity, with significant intratumoral heterogeneity, complicating standard treatment approaches involving radiation (RT) and the DNA-alkylating agent temozolomide (TMZ). In this study, we employed an integrative multi-omics approach, including targeted proteomics, transcriptomics, genomics, and DNA methylation profiling, to investigate the response of a representative panel of GBM patient-derived cancer stem cells (CSCs) to astrocytic differentiation and RT and TMZ treatments. Differentiated CSC progenies retained the expression of key stemness genes and survival pathways, while activating the BMP-Smad signaling pathway and upregulating extracellular matrix components. This was associated with increased resistance to TMZ, though not to RT, across all models. We identified TP53 status as a critical determinant of transcriptional response to both RT and TMZ, which was also modulated by the differentiation state and treatment modality in wildtype (wt) p53 GBM cells. Both mutant and wt p53 models exhibited significant activation of the DNA-damage associated interferon (IFN) response in CSCs and differentiated cells, implicating this pathway in the GBM response to therapy. We observed that activation of NF-κB was positively correlated with the levels of O-6-methylguanine-DNA methyltransferase (MGMT) protein, a direct DNA repair enzyme leading to TMZ resistance, regardless of MGMT promoter methylation status, further supporting the clinical potential for inhibition of NF-kB signaling in GBM treatment. Our integrative analysis of the impact of GBM cell developmental states, in the context of genomic and molecular diversity of patient-derived models, provides valuable insights for pre-clinical studies aimed at optimizing treatment strategies.


Conflict of interest statement

The authors have declared that no competing interests exist.

Figures

Fig 1
Fig 1. Glioblastoma patient-derived models and experimental design.
A) Clinical and molecular data associated with the GBM patient-derived models. GS, Gliosarcoma; M/F, male/female; RT, radiation therapy; TMZ, temozolomide; Rx1, first-line therapy; TTP, time to progression; OS, overall survival; U/M, unmethylated/methylated MGMT promoter. Red outline denotes extrachromosomal (ecDNA) amplification. MDM2, Mouse double minute 2 homolog; CDKN2A, cyclin-dependent kinase inhibitor 2A; NF1, Neurofibromin 1; MYC family, MYC proto-oncogene, bHLH transcription factor; ND, not determined; AMP, amplification; mut, mutation; hom del, homozygous deletion; WT, wild type; 0, diploid. B) Schematic depicting neurosphere culture in NMGF media for selection and amplification of cancer stem cells (CSCs) from surgical specimens, followed by 2 weeks incubation in altered conditions: Withdrawal of growth factors (NM), and addition of 2% or 10% FBS. For the purposes of this study, serum-differentiated cells (SDC) are CSCs progeny cultured in NMGF supplemented with 2% FBS. The effect of the different culture conditions on cell signaling were compared by RPPA. C) The sensitivity of CSC and SDC to single dose radiation (RT) or 5-day TMZ was measured in three select models. Transcriptional and epigenomic reprograming in SDC vs CSC, and in response to treatment were evaluated by bulk RNAseq and 450k DNA methylation array. Panels B and C were generated in BioRender (Created in BioRender. Berezovsky, A. (2024) https://BioRender.com/n49q520).
Fig 2
Fig 2. Targeted proteomics reveals common and cell specific alterations in key signaling CSCs in response to differentiation and identifies interdependencies in activation of key signaling mediators.
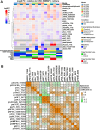
A) Heatmap depicting log2 fold change (FC) relative to NMGF (CSC) for the top 5% most variable proteins/PTM. Each value represents mean log2FC for n = 3 RPPA measurements/group. Proteins/PTMs which were not detected under all three culture conditions were filtered out for each model (grey cells). MUT, mutation; WT, wild type; AMP, amplification; DEL, deletion B) Heatmap of Spearman correlation coefficient values comparing phosphorylation levels in key cell signaling mediators in 8 patient derived GBM models grown in 4 media conditions in triplicates.
Fig 3
Fig 3. Comparative targeted proteomics of CSCs growing in 4 different conditions.
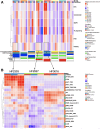
A) Heatmap depicting mean signaling pathway activation for triplicate samples in 4 culture conditions, for CSCs derived from 8 patients with diverse genomic landscape, transcriptional subclass and MGMT promoter methylation. Hierarchical clustering of rows was based on Spearman correlation analysis. B) Heatmap for protein/PTM z-scores involved in cell death and survival signaling for 3 models grown in NMGF (CSC), NM and 2% FBS (SDC), in triplicate (boxes in (A)).
Fig 4
Fig 4. The impact of culture conditions on MGMT protein expression is cell line specific and correlates with NF-κB activation.
A) MGMT protein levels measured by RPPA for HF2303, HF2927 and HF3016, in biological triplicates (S1 Table). P-values for 1-way ANOVA and post-hoc TukeyHSD test for comparison of the effect of culture conditions on MGMT protein expression are shown. Pairwise comparison between culture conditions was only significant for HF2927 and HF3016. B) Correlation of the levels of MGMT and phospho-NFκB (S536), for all 8 GBM models and culture conditions (left panel) and for the 4 models presenting unmethylated MGMT promoter (right panel). Spearman r and 95% CI are shown.
Fig 5
Fig 5. GBM CSCs are more sensitive to temozolomide than SDCs.
A) To compare cell proliferation rates, CSCs and SDCs for each line were plated in the respective media in 96-well assay plates (1,000 cells/well) and cell viability was measured over 11 days in culture (n = 5). Graphs represent mean (SE). The calculated doubling-times (DT, days) are shown, pairwise comparison between CSC and SDC values were significant for HF3016 only (*) p<0.01. B) Cells were plated in 96-well assay plates (2,000/plate) and treated for 5 days with the indicated doses of temozolomide, or equivalent DMSO control. Dose-response curves, the calculated IC50 concentrations with confidence interval (CI), and area above the curve (AAC) expressed as a fraction of total area with SE are shown. For each of the GBM patients, CSCs were significantly more sensitive to TMZ relative to SDCs, as shown by IC50 and AAC ratios, and p-values for dose-response curve comparison (F-test).
Fig 6
Fig 6. Response of glioblastoma CSCs and SDCs to ionizing radiation.
A) CSC and SDC received a single radiation dose (2Gy or 4Gy) or mock radiation (control), and cell viability was measured 5 days later (n = 3–4). No significant difference in sensitivity to RT between CSC and SDCs was observed for any of the lines (Holm-Sidak multiple comparisons test with adj p-value<0.05 threshold). The surviving fraction (SF) values among the 3 cell lines (CSC and SDC combined) were compared by one-way ANOVA, followed by Tukey’s multiple comparisons tests, adj p value<0.0001(***), <0.05 (*). B) Irradiated and control CSCs were implanted intracranially immediately after treatment, 3x10⁵ cells/mouse (n = 6-8/group). Symptom-free survival for the orthotopic PDX is shown in Kaplan-Meier curves, compared by log-rank test. C) Longitudinal live bioluminescense images for representative PDX in (B).
Fig 7
Fig 7. Transcriptional reprograming in glioblastoma cells in response to CSC differentiation.
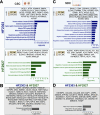
HF2927 and HF2303 CSC were grown in regular neurosphere media or in SDC cultures for 2 weeks. Total RNA from triplicate samples for each group was sequenced analyzed and DEG between CSC and SDC determined for each line. Total number of protein coding (PC) and non-coding (NC) genes, select genes and Metascape gene-set enrichment tests adjusted for multiple comparisons (q-value < 0.05) are shown for genes upregulated in CSCs (A) and in SDCs (C). The common DEGs for both lines along with enriched cellular processes are presented: 43 genes upregulated in CSCs (B) and 25 genes upregulated in SDCs (D). Figure generated using BioRender (Created in BioRender. Berezovsky, A. (2024) https://BioRender.com/n49q520).
Fig 8
Fig 8. Transcriptional response to genotoxic treatment in glioblastoma cells.
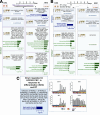
Differentially expressed genes between treated and control samples were determined and enrichment performed as described for Fig 7. A) Transcriptional changes in CSCs and SDCs in response to 4-day TMZ treatment (IC40 concentrations). B) Transcriptional changes in CSCs and SDCs measured 5 days after one dose RT (4 Gy). C) RNA commonly downregulated in HF2303 CSCs in response to differentiation and RT treatment. D) mRNA expression (RPKM) of p53 transcriptional targets CDKN1A (p21), MDM2, and BBC3, and of cell cycle regulators in HF2303 and HF2927 control and treated cells, mean and SE of n = 3. Figure created with Biorender.com (Created in BioRender. Berezovsky, A. (2024) https://BioRender.com/n49q520).
Fig 9
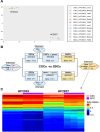
Fig 9. Genome-wide DNA methylation profiling groups samples by patient of origin and identifies DNA methylation alteration patterns between glioblastoma CSCs and their SDCs progeny.
A) t-distributed stochastic neighbor embedding (t-SNE) plot from β-values for all CpG sites comparing HF2303 and HF2927 CSCs and SDCs treated with control, RT or TMZ, in triplicates. B) Schematic showing the significant intersect for HF2303 and HF2927 of differentially expressed genes (DEGs) and differentially methylated positions (DMPs) between CSCs and SDCs. The intersect between DMPs mapped to genes (see Methods) and DEGs are shown. Significance of the intersections was determined using GeneOverlap, p-values and estimated odds ratio are shown; n.s., nonsignificant. C) Heatmap showing the β-values for the 387 DMPs common to HF2303 and HF2927. Fig 9B was created with Biorender.com (Created in BioRender. Berezovsky, A. (2024) https://BioRender.com/n49q520).

References

    1. Louis DN, Perry A, Wesseling P, Brat DJ, Cree IA, Figarella-Branger D, et al.. The 2021 WHO Classification of Tumors of the Central Nervous System: a summary. Neuro-oncology. 2021;23(8):1231–51. Epub 2021/06/30. doi: 10.1093/neuonc/noab106 ; PubMed Central PMCID: PMC8328013. - DOI - PMC - PubMed
    1. Marko NF, Weil RJ, Schroeder JL, Lang FF, Suki D, Sawaya RE. Extent of resection of glioblastoma revisited: personalized survival modeling facilitates more accurate survival prediction and supports a maximum-safe-resection approach to surgery. Journal of clinical oncology: official journal of the American Society of Clinical Oncology. 2014;32(8):774–82. Epub 20140210. doi: 10.1200/JCO.2013.51.8886 ; PubMed Central PMCID: PMC4876349. - DOI - PMC - PubMed
    1. Stupp R, Mason WP, van den Bent MJ, Weller M, Fisher B, Taphoorn MJ, et al.. Radiotherapy plus concomitant and adjuvant temozolomide for glioblastoma. The New England journal of medicine. 2005;352(10):987–96. doi: 10.1056/NEJMoa043330 . - DOI - PubMed
    1. Marenco-Hillembrand L, Wijesekera O, Suarez-Meade P, Mampre D, Jackson C, Peterson J, et al.. Trends in glioblastoma: outcomes over time and type of intervention: a systematic evidence based analysis. Journal of neuro-oncology. 2020;147(2):297–307. Epub 2020/03/12. doi: 10.1007/s11060-020-03451-6 . - DOI - PubMed
    1. Hegi ME, Diserens A-C, Gorlia T, Hamou M-F, de Tribolet N, Weller M, et al.. MGMT Gene Silencing and Benefit from Temozolomide in Glioblastoma. The New England journal of medicine. 2005;352(10):997–1003. doi: 10.1056/NEJMoa043331 - DOI - PubMed

MeSH terms