Characterization of gene expression profiles in Alzheimer's disease and osteoarthritis: A bioinformatics study
- PMID: 39919076
- PMCID: PMC11805404
- DOI: 10.1371/journal.pone.0316708
Characterization of gene expression profiles in Alzheimer's disease and osteoarthritis: A bioinformatics study
Abstract
Background: Alzheimer's disease (AD) and Osteoarthritis (OA) have been shown to have a close association in previous studies, but the pathogenesis of both diseases are unclear. This study explores the potential common molecular mechanisms between AD and OA through bioinformatics analysis, providing new insights for clinical treatment strategies.
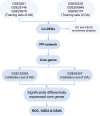
Methods: The AD and OA-related datasets were downloaded from the gene expression database GEO. The datasets were analyzed to obtain differentially expressed gene (DEG) datasets for OA and AD, respectively. The intersection of these DEGs was analyzed to identify common DEGs (Co-DEGs). Subsequently, the Co-DEGs were enriched, and a protein-protein interaction network was constructed to identify core genes. The expression of these genes was validated in a separate dataset, and their diagnostic value for the diseases was analyzed. In addition, the core genes were analyzed using gene set enrichment analysis and single-gene genome variation analysis.
Results: Analysis of DEGs on gene chips from OA and AD patients revealed significant changes in gene expression patterns. Notably, EFEMP2 and TSPO, genes associated with inflammatory responses, showed lower expression levels in both AD and OA patients, suggesting a downregulation in the pathological backgrounds of these diseases. Additionally, GABARAPL1, which is crucial for the maturation of autophagosomes, was found to be upregulated in both conditions. These findings suggest the potential of these genes as diagnostic biomarkers and potential therapeutic targets. However, to confirm the effectiveness of these genes as therapeutic targets, more in-depth mechanistic studies are needed in the future, particularly to explore the feasibility and specific mechanisms of combating disease progression by regulating the expression of these genes.
Conclusions: This study suggests that AD and OA shares common molecular mechanisms. The identification of EFEMP2, GABARAPL1, and TSPO as key target genes highlights potential common factors in both diseases. Further investigation into these findings could lead to new candidate targets and treatment directions for AD and OA, offering promising avenues for developing more effective and targeted therapeutic interventions.
Copyright: © 2025 Liu et al. This is an open access article distributed under the terms of the Creative Commons Attribution License, which permits unrestricted use, distribution, and reproduction in any medium, provided the original author and source are credited.
Conflict of interest statement
NO authors have competing interests.
Figures


Similar articles
-
Analysis of common differential gene expression in synovial cells of osteoarthritis and rheumatoid arthritis.PLoS One. 2024 May 21;19(5):e0303506. doi: 10.1371/journal.pone.0303506. eCollection 2024. PLoS One. 2024. PMID: 38771826 Free PMC article.
-
Identification of crosstalk genes and immune characteristics between Alzheimer's disease and atherosclerosis.Front Immunol. 2024 Aug 12;15:1443464. doi: 10.3389/fimmu.2024.1443464. eCollection 2024. Front Immunol. 2024. PMID: 39188714 Free PMC article.
-
Systems biology-based analysis exploring shared biomarkers and pathogenesis of myocardial infarction combined with osteoarthritis.Front Immunol. 2024 Jul 17;15:1398990. doi: 10.3389/fimmu.2024.1398990. eCollection 2024. Front Immunol. 2024. PMID: 39086489 Free PMC article.
-
Unraveling the transcriptomic landscape of brain vascular cells in dementia: A systematic review.Alzheimers Dement. 2025 Feb;21(2):e14512. doi: 10.1002/alz.14512. Epub 2025 Jan 14. Alzheimers Dement. 2025. PMID: 39807599 Free PMC article.
-
Genetics of menopause-associated diseases.Maturitas. 2001 Nov 30;40(2):103-16. doi: 10.1016/s0378-5122(01)00283-3. Maturitas. 2001. PMID: 11716989 Review.
References
MeSH terms
Substances
LinkOut - more resources
Full Text Sources
Medical

