. 2025 Feb 25;21(4):1762-1786.
doi: 10.1021/acs.jctc.4c01318. Epub 2025 Feb 7.

Constant pH Simulation with FMM Electrostatics in GROMACS. (A) Design and Applications

Affiliations

Constant pH Simulation with FMM Electrostatics in GROMACS. (A) Design and Applications

Eliane Briand et al. J Chem Theory Comput. .

Abstract

The structural dynamics of biological macromolecules, such as proteins, DNA/RNA, or complexes thereof, are strongly influenced by protonation changes of their typically many titratable groups, which explains their sensitivity to pH changes. Conversely, conformational and environmental changes of the biomolecule affect the protonation state of these groups. With few exceptions, conventional force field-based molecular dynamics (MD) simulations neither account for these effects nor do they allow for coupling to a pH buffer. Here, we present design decisions and applications of a rigorous Hamiltonian interpolation λ-dynamics constant pH method in GROMACS, which rests on GPU-accelerated Fast Multipole Method (FMM) electrostatics. Our implementation supports both CHARMM36m and Amber99sb*-ILDN force fields and is largely automated to enable seamless switching from regular MD to constant pH MD, involving minimal changes to the input files. Here, the first of two companion papers describes the underlying constant pH protocol and sample applications to several prototypical benchmark systems such as cardiotoxin V, lysozyme, and staphylococcal nuclease. Enhanced convergence is achieved through a new dynamic barrier height optimization method, and high pKa accuracy is demonstrated. We use Functional Mode Analysis (FMA) and Mutual Information (MI) to explore the complex intra- and intermolecular couplings between the protonation states of titratable groups as well as those between protonation states and conformational dynamics. We identify striking conformation-dependent pKa variations and unexpected inter-residue couplings. Conformation-protonation coupling is identified as a primary cause of the slow protonation convergence notorious to constant pH simulations involving multiple titratable groups, suggesting enhanced sampling methods to accelerate convergence.


Conflict of interest statement

The authors declare no competing financial interest.

Figures
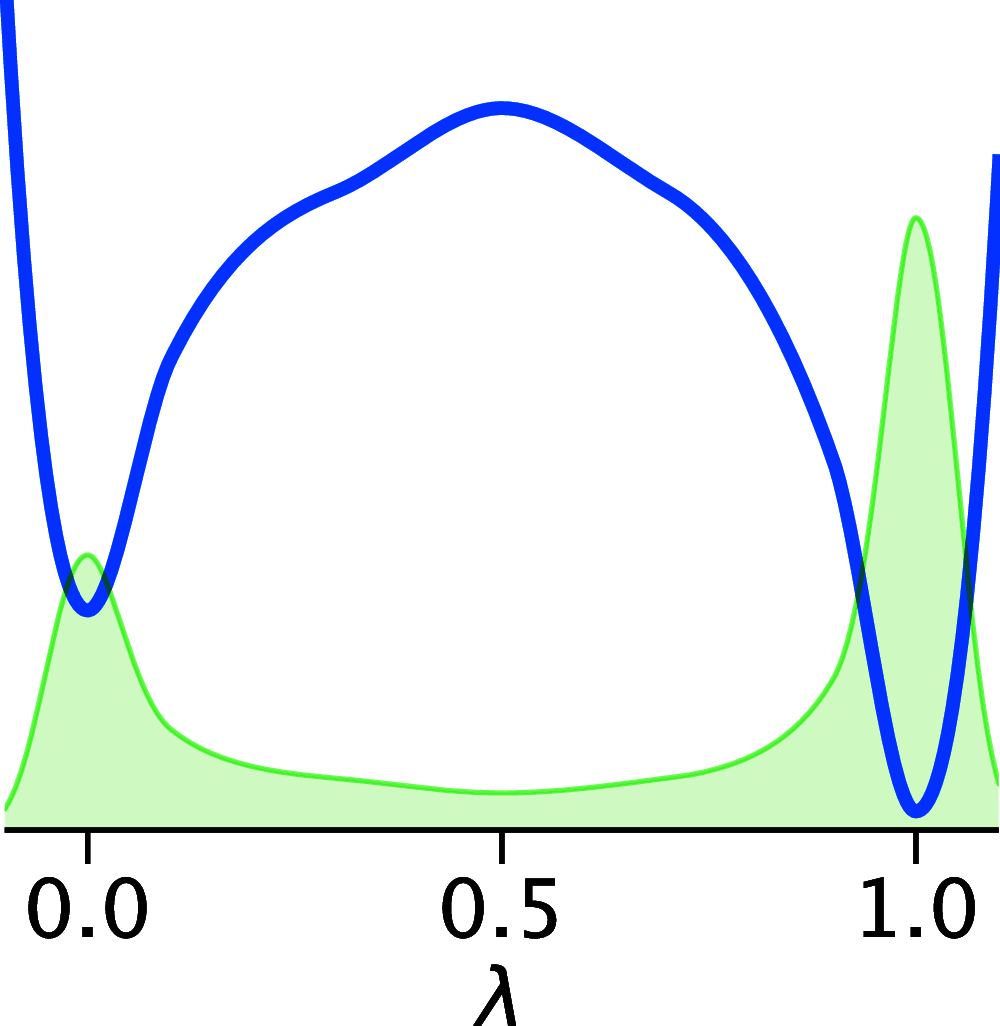
Figure 1
Figure 1
Shape of the double well potential Vdw(λ) (blue), with population histogram in green (at an exaggerated temperature for illustration purpose). The spline corresponding to the shape is defined in the Supporting Information (Section 6).
Figure 2
Figure 2
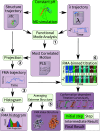
Flowchart of FMA-related analysis, starting with constant pH MD (green), followed by intermediate processing (light green), yielding intermediate (light purple) and final results (dark purple). Circled numbers are referenced in the main text. Icons, plots and data in this figures are for illustration purposes.
Figure 3
Figure 3
Minimal but fully functional .mdp parameters for constant pH simulations.
Figure 4
Figure 4
Titration of an Asp residue. Left: Excerpt of a trajectory of the λp value at pH = 4. Red intervals indicate the number of frames assigned to the protonated and deprotonated states. Right: Resulting titration curve, with blue dots showing the fraction of deprotonated frames for each replica at each pH point. Black dots show the average of all replicas. The dashed blue line is a Henderson–Hasselbalch (H–H) fit.
Figure 5
Figure 5
Computational vs experimental titration of short peptides. Shown are pKa values (left) and Hill coefficients (right), calculated using CHARMM36m (red) and Amber99sb*-ILDN (blue), and measured by NMR (black). Error bars indicate bootstrapped 95% confidence intervals. The reference pKa values for single residues (Glu 4.08, His 6.54) as well as the unity Hill coefficient n are shown as dashed green lines, representing the behavior of isolated solvated amino acids for comparison.
Figure 6
Figure 6
Computational vs experimental titration of Cardiotoxin V. Left: pKa values calculated using CHARMM36m (red) and Amber99sb*-ILDN (blue), and measured by NMR (black). Error bars indicate bootstrapped 95% confidence intervals. Right: Titration curve for His 4 (top) and Glu 17 (bottom), with fraction of deprotonated frames for each replica (point) and the H–H fit to simulation data as solid line. The dashed line is a H–H curve based on the NMR pKa values.
Figure 7
Figure 7
FMA analysis for the His 4 residue of cardiotoxin V. (A): Histogram of FMA projection values for all replicas at pH = 4.5 (left axis) and pKa as a function of the projection value (black curve, right axis). (B), (C): Low and high FMA value structure, respectively. (D): Separate titration curves for the six colored bins shown in A (colors correspond), with fraction of deprotonated frames for each replica (points), H–H-fits to these fractions (solid lines), and H–H-curves (black dashed lines) based on the measured pKa value.
Figure 8
Figure 8
Sample FMA trajectories for the His 4 and Asp 42 residues of cardiotoxin V, for the three first replicas, at pH = 4.0.
Figure 9
Figure 9
FMA analysis for the Asp 42 residue of cardiotoxin V. (A) Computational titration of Asp 42, with fraction of deprotonated frames for each replica (point) and the H–H fit to simulation data as solid line. The dashed line is a H–H curve based on the NMR pKa values. (B) Histogram of FMA projection values for all replicas at pH = 4.0 (left axis) and pKa as a function of the projection value (black curve, right axis). (C) Low and high FMA value structure in beige and cyan, respectively, with pseudobond for relevant stabilizing interactions with Asp 42.
Figure 10
Figure 10
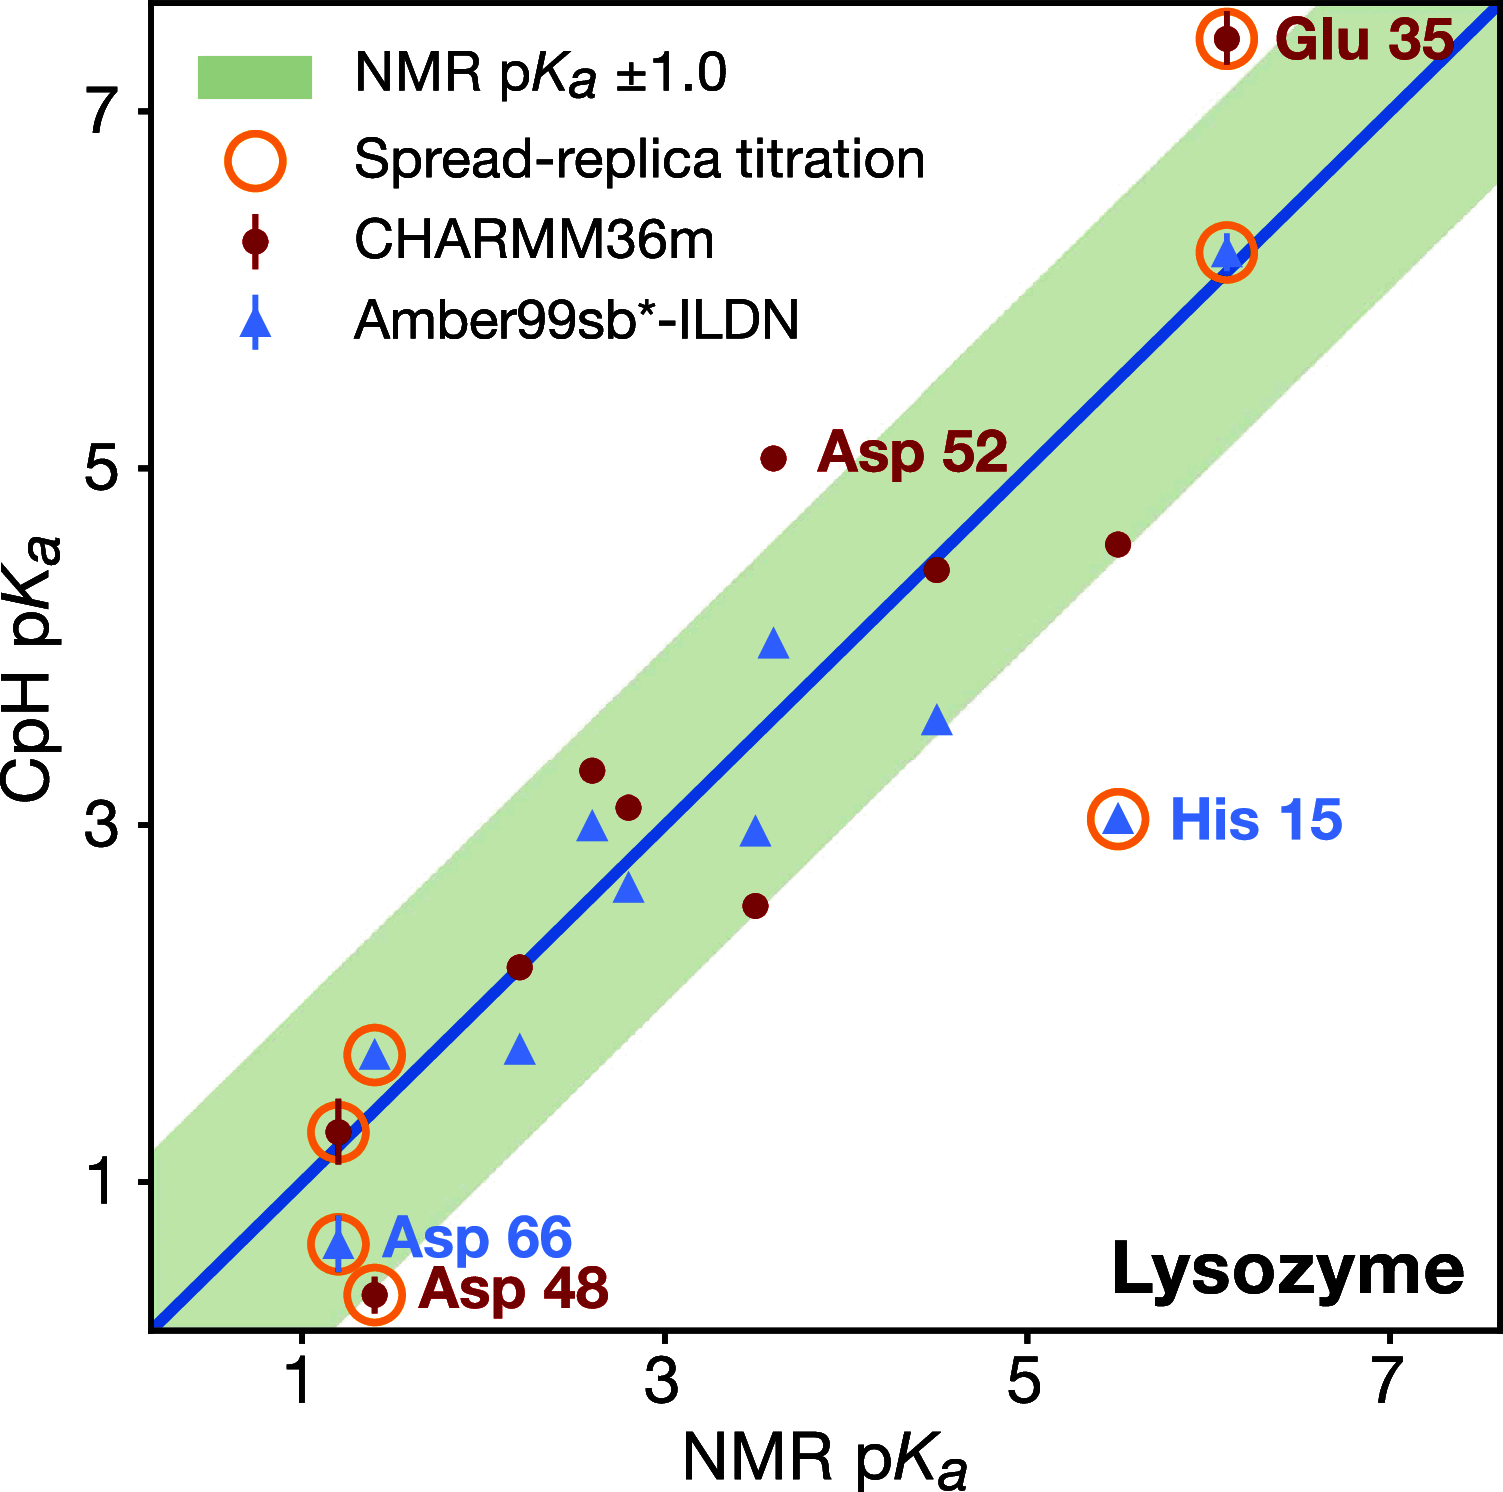
Comparison of residue pKa values from NMR titration (x axis) and CPH-MD simulation (y axis) in HEWL for CHARMM36m (red circles) and Amber99sb*-ILDN (blue triangles), with bootstrapped 95% confidence intervals as error bars. The green region indicates ≤1 pH point of difference between NMR and simulation. Residues with spread-replica titration are highlighted by orange circles. (pKa table available in Supporting Information section 2.3).
Figure 11
Figure 11
Computational titration curves of Asp 119, His 15 and Asp 66 for HEWL, using Amber99sb*-ILDN. Transparent points show the deprotonation fraction computed for each replica. The solid line corresponds to the H–H sigmoid fitted to all replicas.
Figure 12
Figure 12
Conformation–protonation coupling in HEWL. Superimposed are the structures corresponding to the FMA projection low (beige) and high (cyan) values for Asp 48 (A) and Asp 66 (B), respectively. Highlighted by color are only those regions which show marked structural differences. (C) Sketch of the proposed coupling mechanism discussed in the text..
Figure 13
Figure 13
Comparison of residue pKa values from NMR titration (x axis) and CPH-MD simulation (y axis). Same as Figure 10, but for staphylococcal nuclease. Dashed horizontal lines mark residues for which only a measured upper bound of 2.2 was reported, compatible with the corresponding pKa values calculated from CPH simulations. (pKa table available in Supporting Information section 2.4.)
Figure 14
Figure 14
Residue–residue coupling in the Asp 19 (A) – Asp 21 (B) and Glu 75 (D) – His 121 (E) pairs of staphylococcal nuclease. (A,B,D,E): Computational titration curves for individual residues. (C,F): Macroscopic titration curves for the pairs, i.e., number of protons bound to both residues. Deprotonation fraction (A, B, D, E) or number of proton bound (C, F) shown for each replica (transparent circle) and averaged across replicas (black outlined circles). Fit to both per-residue and macroscopic titration curves shown as solid lines. Inflection points in the macroscopic titration curve (dashed vertical lines) mark the macroscopic pKa values, with the corresponding H–H curves shown as dashed lines.
Figure 15
Figure 15
Effect of Dynamic Barrier Optimization (DBO) on protonation transition rates and pKa convergence for the GEAEG pentapeptide. Transition rates (A) and fraction of unphysical lambda values (B) observed in titration simulations for selected pH values, (C) precision in terms of pKa confidence intervals widths. The colors indicate fixed barrier (blue, green) vs DBO (yellow, red) for residues Glu2 (blue, yellow) and Glu4 (green, red), respectively. The maximum tolerated unphysical fraction of frames (25%) with 5% threshold is indicated as a green bar in panel B; the 0.03 confidence interval (black line) in panel C indicates our convergence criterion. Black bars show standard deviations.
Figure 16
Figure 16
Impact of DBO on the titration of cardiotoxin V (blue) and HEWL (red). (A) Comparison of pKa values with and without DBO, with the green region indicating difference ≤1 pKa point. Error bars are 95% confidence intervals. (B) Comparison of precision in terms of pKa confidence interval width. Residues for which the confidence interval is narrower when DBO is used lie in the green region, and residues with spread-replica titration are highlighted by orange circles.
Figure 17
Figure 17
Residue–residue coupling and microstate fraction heterogeneity in staphylococcal nuclease. Shown is the fraction of time during which Asp 19 is protonated and, simultaneously, Asp 21 is deprotonated (A1H/A2 microstate). (A): as a function of pH, for each replica (transparent circle) and averaged across replicas (black outlined circle). (B): as a function of time for four replicas at pH 4.0, computed in 1.5 ns windows.
Figure 18
Figure 18
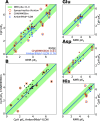
Aggregate comparison between calculated and measured pKa values for CHARMM36m (red circles) and Amber99sb*-ILDN (blue triangles), with bootstrapped 95% confidence intervals as error bars. The green region indicates ≤1 pKa point deviation. Residues with spread-replica titration are highlighted by orange circles. (A): Comparison between NMR and constant pH pKa values for all residues. (Glu), (Asp), (His): for specific residue types. (B): between CHARMM36m and Amber99sb*-ILDN.

Similar articles

Cited by

References

    1. Bettati S.; Mozzarelli A.; Perutz M. F. Allosteric mechanism of haemoglobin: rupture of salt-bridges raises the oxygen affinity of the T-structure. J. Mol. Biol. 1998, 281, 581–585. 10.1006/jmbi.1998.1983. - DOI - PubMed
    1. Tang Y.; Grey M. J.; McKnight J.; Palmer A. G.; Raleigh D. P. Multistate Folding of the Villin Headpiece Domain. J. Mol. Biol. 2006, 355, 1066–1077. 10.1016/j.jmb.2005.10.066. - DOI - PubMed
    1. Baptista A. M.; Martel P. J.; Petersen S. B. Simulation of protein conformational freedom as a function of pH: constant-pH molecular dynamics using implicit titration. Proteins 1997, 27, 523–544. 10.1002/(SICI)1097-0134(199704)27:4<523::AID-PROT6>3.0.CO;2-B. - DOI - PubMed
    1. Lee M. S.; Salsbury Jr F. R.; Brooks C. L. III Constant-pH molecular dynamics using continuous titration coordinates. Proteins 2004, 56, 738–752. 10.1002/prot.20128. - DOI - PubMed
    1. Dlugosz M.; Antosiewicz J. M. Constant-pH molecular dynamics simulations: a test case of succinic acid. Chem. Phys. 2004, 302, 161–170. 10.1016/j.chemphys.2004.03.031. - DOI

MeSH terms

LinkOut - more resources