. 2025 Feb 25;21(4):1787-1804.
doi: 10.1021/acs.jctc.4c01319. Epub 2025 Feb 7.

Constant pH Simulation with FMM Electrostatics in GROMACS. (B) GPU Accelerated Hamiltonian Interpolation

Affiliations

Constant pH Simulation with FMM Electrostatics in GROMACS. (B) GPU Accelerated Hamiltonian Interpolation

Bartosz Kohnke et al. J Chem Theory Comput. .

Abstract

The structural dynamics of biological macromolecules, such as proteins, DNA/RNA, or their complexes, are strongly influenced by protonation changes of their typically many titratable groups, which explains their pH sensitivity. Conversely, conformational and environmental changes in the biomolecule affect the protonation state of these groups. With a few exceptions, conventional force field-based molecular dynamics (MD) simulations do not account for these effects, nor do they allow for coupling to a pH buffer. The λ-dynamics method implements this coupling and thus allows for MD simulations at constant pH. It uses separate Hamiltonians for the protonated and deprotonated states of each titratable group, with a dynamic λ variable that continuously interpolates between them. However, rigorous implementations of Hamiltonian Interpolation (HI) λ-dynamics are prohibitively slow for typical numbers of sites when used with particle mesh Ewald (PME). To circumvent this problem, it has recently been proposed to interpolate the charges (QI) instead of the Hamiltonians. Here, in the second of two companion papers, we propose a rigorous yet efficient Multipole-Accelerated Hamiltonian Interpolation (MAHI) method to perform λ-dynamics in GROMACS. Starting from a charge-scaled Hamiltonian, precomputed with the Fast Multipole Method (FMM), the correct HI forces are calculated with negligible computational overhead. However, other electrostatic solvers, such as PME, can also be used for the precomputation. We compare Hamiltonian interpolation with charge interpolation and show that HI leads to more frequent transitions between protonation states, resulting in better sampling and accuracy. Our accuracy and performance benchmarks show that introducing, e.g., 512 titratable sites to a one million atom MD system increases runtime by less than 20% compared to a regular FMM-based simulation. We have integrated the scheme into our GPU-accelerated FMM code for the simulation software GROMACS, allowing easy and effortless transitions from standard force field simulations to constant pH simulations.


Conflict of interest statement

The authors declare no competing financial interest.

Figures

Figure 1
Figure 1
FMM far field calculation. The five individual steps and operators involved in the far field calculation, shown for the lowest two levels of the octree: ① P2M: at the lowest level, the individual charges (yellow dots) are combined into a multipole representation. ② M2M: the multipoles of the higher levels are derived from those of the lower levels (blue). ③ M2L: the multipoles (blue) are transformed into local moments (pink) at each level of the tree. ④ L2L: the local moments are propagated down the tree to the deepest level. ⑤ The local moments are used to calculate the far field contribution to the forces on the particles.
Figure 2
Figure 2
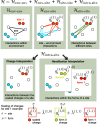
Sketch of the four different types of interactions that occur in an MD system with titratable sites. Each gray box illustrates one term of eqs 6 and 12, with particles as circles and interactions as lines. The first three terms (top three boxes) are calculated from scaled charges (i, orange circles) and are identical for Hamiltonian (HI) and charge interpolation (QI). HI differs from QI for the intra-site interactions (gray boxes in the middle), which are calculated from scaled charges for QI (left), but from pure charges (yellow and red) for HI (right). Scaled charges are obtained by weighing form 0 (yellow) and form 1 (red), as seen at the bottom.
Figure 3
Figure 3
Starting from a charge-scaled Hamiltonian, the MAHI scheme calculates the correct (periodic) formula image interactions for Hamiltonian interpolation (HI). The central magenta box shows the actual simulation volume containing a two-atomic site (black/green dots), while the surrounding boxes are periodic images. (A) First, FMM calculates the interactions for the scaled charges using multipole expansion in the yellow areas. (B) Corrections are then computed so that HI is retrieved for a site with charges QP2P and formula image (green). Here, in contrast to a regular FMM, all corrections to interactions coming from the first layer around the central box are computed directly (blue), while corrections from distant boxes are handled by a lattice operator (yellow).
Figure 4
Figure 4
Benzene ring solvated in water. The ball-and-stick drawing shows hydrogen atoms in white, carbon atoms in cyan, and oxygen atoms in red.
Figure 5
Figure 5
Quantification of the accuracy of the MAHI scheme. The plots show the relative deviation of the MAHI forces from the reference forces for the 1010 particle test system with typical particle distribution (a) and (b), and with hypothetical worst-case particle distribution (c) and (d). FMM depth d indicated by color, d = 0 (black), d = 1 (blue), d = 2 (purple), d = 3 (orange).
Figure 6
Figure 6
Comparison of the force acting on the λ particle as calculated by PME and FMM for uncharging benzene. The benzene ring carries its full charge at t = 0.0 ps (λ = 0), while at t = 2.0 ps (λ = 1) it is fully uncharged. FMM-computed formula image values in orange, PME in blue.
Figure 7
Figure 7
Scaling of the FMM based MAHI scheme for different numbers of sites and particles. Each site contains two forms. Results are shown only for the optimal tree depth.
Figure 8
Figure 8
Costs of adding new forms to existing sites. Results are shown for FMM tree depths of d = 3 (circles) and d = 4 (stars) for the random systems. Baseline is the FMM performance with sites containing two forms (one λ value).
Figure 9
Figure 9
Comparison of FMM runtime with and without constant pH. This benchmark uses one site with ten particles for every 4000 particles in the system, as estimated from lysozyme.
Figure 10
Figure 10
GROMACS performance with FMM and PME electrostatics for different constant pH simulation systems. (a) A single titratable Glu in water–water boxes of increasing size. (b) Relative performance for SNase with PME- and FMM-based MAHI compared to a fixed protonation simulation. Costs of PME-based charge scaling estimated from Aho et al. (c) GROMACS performance with varying number of sites for FMM- and PME-based MAHI. *Preliminary results.
Figure 11
Figure 11
Comparison of Hamiltonian interpolation (HI) and charge interpolation (QI) constant pH simulations. Cumulative number of transitions for a single Glu residue in water (A), and for Glu 57 (B) and Glu 10 (D) in the SNase protein. Transparent lines correspond to individual replicas, solid lines to the average; HI in blue and QI in red. In (C), the transition rates of all Glu residues in SNase are compared. Error bars give standard deviation across replicas. Dashed line indicates how much an additional barrier of 1 kBT reduces the transition rate in a TST model.
Figure 12
Figure 12
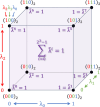
Sketch showing how λ is mapped to λ̃. Multistate model for an exemplary site with eight forms, demonstrating the mapping of λ values to their corresponding λ̃ values.

References

    1. Mochizuki K.; Fujii T.; Paul E.; Anstey M.; Uchino S.; Pilcher D. V.; Bellomo R. Acidemia subtypes in critically ill patients: An international cohort study. Journal of critical care 2021, 64, 10–17. 10.1016/j.jcrc.2021.02.006. - DOI - PubMed
    1. Osman J. J.; Birch J.; Varley J. The response of GS-NS0 myeloma cells to pH shifts and pH perturbations. Biotechnol. Bioeng. 2001, 75, 63–73. 10.1002/bit.1165. - DOI - PubMed
    1. Dill K. A.; Shortle D. Denatured states of proteins. Annu. Rev. Biochem. 1991, 60, 795–825. 10.1146/annurev.bi.60.070191.004051. - DOI - PubMed
    1. Talley K.; Alexov E. On the pH-optimum of activity and stability of proteins. Proteins Struct. Funct. Bioinf. 2010, 78, 2699–2706. 10.1002/prot.22786. - DOI - PMC - PubMed
    1. Kishore D.; Kundu S.; Kayastha A. M. Thermal, chemical and pH induced denaturation of a multimeric β-galactosidase reveals multiple unfolding pathways. PloS one 2012, 7, e5038010.1371/journal.pone.0050380. - DOI - PMC - PubMed

LinkOut - more resources