. 2025 Feb 7;11(6):eadp5539.
doi: 10.1126/sciadv.adp5539. Epub 2025 Feb 7.

A SARS-CoV-2 vaccine on an NIR-II/SWIR emitting nanoparticle platform

Affiliations

A SARS-CoV-2 vaccine on an NIR-II/SWIR emitting nanoparticle platform

Yingying Jiang et al. Sci Adv. .

Abstract

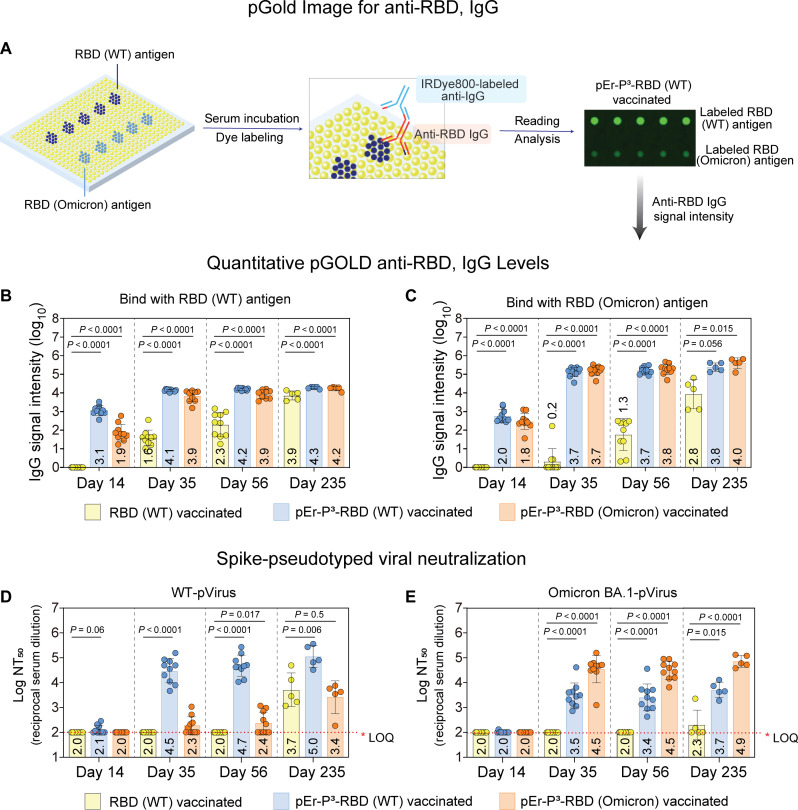
The COVID-19 pandemic caused a global health crisis that resulted in millions of deaths. Effective vaccines have played central roles in curtailing the pandemic. Here, we developed a down-converting near-infrared IIb (NIR-IIb; 1500 to 1700 nanometers) luminescent, pure NaErF4@NaYF4 rare-earth nanoparticle (pEr) as vaccine carriers. The pEr nanoparticles were coated with three layers of cross-linked biocompatible polymers (pEr-P3; ~55 nanometers) and conjugated to the receptor binding domain (RBD) of the severe acute respiratory syndrome coronavirus 2 (SARS-CoV-2) spike protein. Upon subcutaneous injection of the pEr-P3-RBD nanovaccine in mice, in vivo NIR-IIb imaging revealed active vaccine trafficking and migration to lymph nodes through lymphatic vessels. Two doses of the adjuvant-free vaccine elicited long-lasting (>7 months) high titers of serum viral neutralization antibody and anti-RBD immunoglobulin G, along with robust RBD-specific germinal center B cells and T follicular helper cells. We devised in vivo NIR-II molecular imaging of RBD-specific cells in lymph nodes, opening noninvasive assessments of vaccine-elicited immune responses longitudinally.


Figures

Fig. 1.
Fig. 1.. NIR-II/SWIR luminescent nanoparticles for the SARS-CoV-2 pEr-P3-RBD nanovaccine.
(A) Schematic of the pEr-P3-RBD (RBD conjugated to ─NH2 groups on the pEr-P3 surface via EDC chemistry). P3 refers to cross-linked three layers of hydrophilic polymers coated on the pEr nanoparticles. (B) TEM image of pEr nanoparticles comprised the NaErF4 core and NaYF4 shell; scale bar, 20 nm. (C) Energy level diagram of the erbium showing the NIR-II down conversion pathway. (D) Absorption (red curve) and emission (blue curve) spectra of pEr nanoparticles in cyclohexane (prior to P3 coating). The dashed vertical line shows the excitation wavelength (975 nm) for pEr nanoparticles. a.u., arbitrary units. (E) DLS spectra of pEr in cyclohexane (gray), hydrophilic pEr-P3 in 1×PBS buffer (blue). The average size for pEr nanoparticles is ~25.5 nm, and that for pEr-P3 nanoparticles is ~55.5 nm.
Fig. 2.
Fig. 2.. In vivo NIR-IIb imaging/tracking of subcutaneously administrated pEr-P3-RBD vaccine.
(A) Immunization schedule; female BALB/c mice (n = 10) aged 6 weeks were immunized by subcutaneous injection at the mouse tail base with the pEr-P3-RBD nanovaccine on day 0 and day 21. (B) Simplified schematic of the in vivo NIR-II imaging system. CCD, charge-coupled device. (C) NIR-IIb luminescence images (975-nm excitation with a power density of ~50 mW cm−2, 1500- to 1700-nm detection, and the exposure time is 20 ms, continuous wave mode) showing the nanovaccine migrated from the injection site to mice iLNs along the lymphatic vessels and then to the proper aLNs after subcutaneous injection at the tail base of a mouse. Images were recorded at 6 hours after prime injection. h, hours. (D) Averaged pEr-P3-RBD signals in iLNs of mice normalized by background signals (in a region away from the LNs) plotted as a function of time after subcutaneous injection of pEr-P3-RBD vaccines. Error bars represent the SD of five repeated experiments. Data are presented as mean values ± SD.
Fig. 3.
Fig. 3.. Humoral antibody responses elicited by the pEr-P3-RBD nanovaccine.
The humoral antibody responses were detected using the pGOLD nanoplasmonic platform and pseudoviral neutralization antibody assay. (A) Note that RBD (WT)/RBD (Omicron) antigens were printed on the surface of pGOLD (62). Anti-RBD in the mouse serum are first captured by the assay and the labeled with anti-mouse IgG-infrared fluorescent dye (IgG-IRDye800). Binding between IgG with antigens is evaluated by reading the fluorescence intensities of IRDye800. (B) Quantitative anti-RBD (WT) IgG levels and (C) anti-RBD (Omicron) IgG levels in the serum of the mice vaccinated with RBD (WT) antigen-only, pEr-P3-RBD (WT), and pEr-P3-RBD (Omicron BA.1) without any adjuvant. The serum was collected on day 14, day 35, day 56, and day 235. Each point represents an individual animal. Error bars represent the SD of 10 (day 14, day 35, and day 56) or 5 (day 235) repeated experiments. Data are presented as mean values ± SD. (D) Log NT50 for the neutralizing antibody levels against the WT SARS-CoV-2 pseudovirus and (E) Omicron BA.1 SARS-CoV-2 pseudovirus in the serum of the mice vaccinated with RBD (WT) antigens, pEr-P3-RBD (WT), and pEr-P3-RBD (Omicron BA.1) without any adjuvants. Each dose of the vaccine contains 10 μg of RBD antigens. Note that, in (D) and (E), each point represents the NT50 titer measured with an individual animal. Error bars represent the SD of 10 (day 14, day 35, and day 56) or 5 (day 235) repeated experiments. The NT50 of 1:100 dilution is set as the limit of quantitation (LOQ).
Fig. 4.
Fig. 4.. GC B cell and TFH cell responses induced by the pEr-P3-RBD vaccine.
The 6-week-old C57BL/6 mice were immunized by RBD (WT) antigen-only and pEr-P3-RBD (WT) on day 0 and day 21 without any adjuvant, and flow cytometry analysis of iLNs conducted on day 35. (A) GC B cells (CD19+CD95+GL7+), (B) class-switched (IgM) within GC B cells (CD19+CD95+GL7+IgM), (C) RBD-specific GC (CD19+GL7+CD95+RBD-binding+), and (D) TFH cell response in iLNs on day 35; n = 8 for each group. One-way analysis of variance (ANOVA) followed by Tukey’s test was applied in (A) to (D). Differences between groups were considered significant for P values < 0.05. Error bars represent the SD of eight repeated experiments. Data are presented as mean values ± SD.
Fig. 5.
Fig. 5.. In vivo NIR-IIb molecular imaging of RBD-specific cells in LNs of mice after immunization.
(A) Immunization schedule; the female BALB/c mice were immunized by subcutaneous (sc) injection at the mouse tail base with the pEr-P3-RBD (WT) nanovaccine on day 0 and day 21 treated with only PBS were used as a control group; n = 3 in each group. The mice were injected the IR840-RBD (WT) at the mouse tail base (subcutaneously) on day 35. (B) Color photograph and multiplexed NIR-II imaging were conducted on pEr-P3, IR840 in PBS buffer. Under 808-nm excitation and 1000- to 1200-nm imaging conditions, only IR840 was detectable whereas pEr-P3 was undetectable. Under 975-nm excitation and 1500- to 1700-nm imaging conditions, only pEr-P3 was detectable whereas IR840 was undetectable. (C) NIR-II luminescence images (808-nm excitation with a power density of ~70 mW cm−2, 1000- to 1200-nm detection, and the exposure time is 10 ms) showing the IR840-RBD (WT) trafficking pathways in mice immunized by pEr-P3-RBD (WT) and (D) treated by only PBS. Images were recorded at different time points as indicated after injection. Representative images from one mouse from each group are shown here. d, days. (E) In vivo IR840-RBD (WT) signal intensity in iLNs and (F) bladder normalized by the background plotted as a function of time after subcutaneous injection of IR840-RBD (WT). Error bars represent the SD of three repeated experiments. Data are presented as mean values ± SD. (G) pEr-P3-RBD (WT) vaccine or only PBS induces RBD-specific cell response in iLNs at day 35. The percentage of RBD-specific cells in live cells was counted by flow cytometry. Error bars represent the SD of eight repeated experiments. Data are presented as mean values ± SD.

References

    1. World Health Organization, WHO Coronavirus Disease (COVID-19) Dashboard, https://covid19.who.int/ [accessed 27 June 2023].
    1. World Health Organization, COVID-19 Vaccines with WHO Emergency Use Listing, https://extranet.who.int/prequal/vaccines/covid-19-vaccines-who-emergenc....
    1. World Health Organization, COVID-19 vaccine tracker and landscape, https://who.int/publications/m/item/draft-landscape-of-covid-19-candidat....
    1. Yap C., Ali A., Prabhakar A., Prabhakar A., Pal A., Lim Y. Y., Kakodkar P., Comprehensive literature review on COVID-19 vaccines and role of SARS-CoV-2 variants in the pandemic. Ther. Adv. Vaccines Immunother. 9, 25151355211059791 (2021). - PMC - PubMed
    1. Levine-Tiefenbrun M., Yelin I., Alapi H., Katz R., Herzel E., Kuint J., Chodick G., Gazit S., Patalon T., Kishony R., Viral loads of Delta-variant SARS-CoV-2 breakthrough infections after vaccination and booster with BNT162b2. Nat. Med. 27, 2108–2110 (2021). - PubMed

MeSH terms