. 2025 Mar 6;188(5):1248-1264.e23.
doi: 10.1016/j.cell.2025.01.024. Epub 2025 Feb 6.

GUK1 activation is a metabolic liability in lung cancer

Affiliations

GUK1 activation is a metabolic liability in lung cancer

Jaime L Schneider et al. Cell. .

Abstract

Little is known about metabolic vulnerabilities in oncogene-driven lung cancer. Here, we perform a phosphoproteomic screen in anaplastic lymphoma kinase (ALK)-rearranged ("ALK+") patient-derived cell lines and identify guanylate kinase 1 (GUK1), a guanosine diphosphate (GDP)-synthesizing enzyme, as a target of ALK signaling in lung cancer. We demonstrate that ALK binds to and phosphorylates GUK1 at tyrosine 74 (Y74), resulting in increased GDP biosynthesis. Spatial imaging of ALK+ patient tumor specimens shows enhanced phosphorylation of GUK1 that significantly correlates with guanine nucleotides in situ. Abrogation of GUK1 phosphorylation reduces intracellular GDP and guanosine triphosphate (GTP) pools and decreases mitogen-activated protein kinase (MAPK) signaling and Ras-GTP loading. A GUK1 variant that cannot be phosphorylated (Y74F) decreases tumor proliferation in vitro and in vivo. Beyond ALK, other oncogenic fusion proteins in lung cancer also regulate GUK1 phosphorylation. These studies may pave the way for the development of new therapeutic approaches by exploiting metabolic dependencies in oncogene-driven lung cancers.

Keywords: ALK; GDP; GUK1; Ras signaling; anaplastic lymphoma kinase; cancer metabolism; guanylate kinase 1; lung cancer; non-small cell lung cancer; tyrosine kinase inhibitor.


Conflict of interest statement

Declaration of interests J.L.S. has received honoraria from the Academy of Continued Healthcare Learning, Springer Healthcare, Targeted Oncology, Total Health Conferencing, DAVA Oncology, and Physicians’ Education Resource; travel funding from Dava Oncology; and research funding from Gilead. M.M.-K. has royalties from Elsevier and consults for AstraZeneca, Bristol Myers Squibb, Sanofi, Roche, Boehringer Ingelheim, Innate, Daiichi-Sankyo, and AbbVie. T.F. has research grants from Takeda Science Foundation, Eli Lilly Japan K.K., Nuvalent, Inc., and Kinnate Biopharma Inc. outside the submitted work and a patent for KU220115PCT pending. L.V.S. has institutional research funding from AstraZeneca, Novartis, and Delfi diagnostics. S.P.G. is a member of the scientific advisory board of Cell Signaling Technologies and ThermoFisher Scientific. A.N.H. has grant/research support from Amgen, Blueprint Medicines, BridgeBio, Bristol-Myers Squibb, C4 Therapeutics, Eli Lilly, Novartis, Nuvalent, Pfizer, Roche/Genentech, and Scorpion Therapeutics and consults/advises for Engine Biosciences, Nuvalent, Oncovalent, TigaTx, and Tolremo Therapeutics. J.J.L. has received institutional research funding from Hengrui Therapeutics, Turning Point Therapeutics, Novartis, Neon Therapeutics, Bayer, Roche/Genentech, Pfizer, Elevation Oncology, Relay Therapeutics, Linnaeus Therapeutics, and Nuvalent; honoraria or consulting fees from Genentech, C4 Therapeutics, Blueprint Medicines, Nuvalent, Bayer, Elevation Oncology, Novartis, Mirati Therapeutics, Regeneron, Pfizer, Takeda, Ellipses Pharma, Hyku BioSciences, AnHeart Therapeutics, Claim Therapeutics, Merus, Bristol Myers Squibb, Daiichi Sankyo, AstraZeneca, Yuhan, and Turning Point Therapeutics; and travel fees from Pfizer and Merus. K.M.H. receives research funding from TUQ Therapeutics and Revolution Medicines. M.C.H. is on the scientific advisory board for MitoQ, Alixia Therapeutics, and Minovia and is a scientific founder and a consultant for Refuel Bio. M.C.H. receives unrelated research funding from Refuel Bio.

Figures

Figure 1.
Figure 1.. Phosphoproteomics identifies GDP-synthesizing enzyme, GUK1, as a target of oncogenic ALK.
(A) Schematic representation of the phosphoproteomic screen: The pY1000 antibody was used for enriching phospho-tyrosine (pY) peptides. (B) Western blot analysis conducted on a panel of ALK TKI-sensitive and ALK TKI-resistant cell lines: SW1573 and Calu-1 were utilized as ALK-control cell lines, and lorlatinib (1 μM) was administered for 1 hour. The asterisk (*) denotes the cell lines used in the phosphoproteomic screen. (C) A total of 1,665 unique phosphorylation sites across 972 distinct proteins were identified in four different cell lines. The log2 fold change (FC) cutoff of −1 indicates pY sites that exhibited hypo-phosphorylation upon lorlatinib treatment. (D) Among 3,232 curated human metabolic proteins, 150 metabolic proteins with 239 unique pY sites were identified across 972 distinct proteins. (E) Functional enrichment analysis was performed using g:Profiler to analyze REACTOME pathways of all metabolic genes. The Benjamini-Hochberg FDR approach was employed for multiple testing correction. (F) Rank plot illustrating all tyrosine-phosphorylated metabolic genes. ALK+ cells include H3122, MGH045–1, MGH919–5. (G) The Log2 FC of pY sites of enzymes involved in nucleotide metabolism is presented. ALK+ cells include H3122, MGH045–1, MGH919–5. See also Figure S1.
Figure 2.
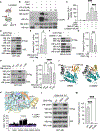
Figure 2.. ALK-mediated phosphorylation of GUK1 at Y74 augments GDP biosynthesis.
(A) Schematic illustrating that GUK1 may be a target of ALK kinase activity. (B) Western blot analysis of an in vitro tyrosine kinase assay using recombinant ALK (rALK) and recombinant ALK (rALK) wild-type (WT) protein. (C) In vitro rGUK1 enzyme activity assay in the presence or absence of rALK. GMP was used as a substrate to initiate the reaction. (D) Western blot analysis of anti-FLAG immunoprecipitants (IP) and whole-cell lysates (WCL) from 293T cells co-expressing FLAG-GUK1 WT with either a control vector or EML4-ALK v3 fusion protein. (E) GUK1 enzyme activity of the corresponding anti-FLAG IP from 293T cells. (F) Western blot analysis of anti-FLAG IP and WCL from ALK TKI-sensitive MGH919–5 cells. (G) GUK1 enzyme activity of the corresponding anti-FLAG immunoprecipitants (IP) from ALK TKI-sensitive MGH919–5 cells. (H) Western blot analysis of anti-FLAG IP and WCL from 293T cells co-expressing FLAG-GUK1 WT, GUK1 Y74F mutant with either a control vector or EML4-ALK v3 fusion protein. (I) GUK1 enzyme activity of the corresponding anti-FLAG IP from 293T cells co-expressing FLAG-GUK1 WT, GUK1 Y74F with either a control vector or EML4-ALK v3 fusion protein. (J) Left: GUK1 in its unbound and open conformation showing the different protein domains. Right: binding of nucleotide (ADP, brown circle) and GMP (black circle). OPEN structure: PDB code 6NUI. CLOSED structure: PDB code 1LVG. (K) Top: Closed structure of GUK1 GMP-binding domain (GMP-BD). Residues in yellow or orange are from either the helical or beta-sheet sub-domains of the GMP-BD. The black dashed lines represent H-bonds between L80 and T40. ATP was modeled by ADP substrate alignment with coordinates from PDB code 6LN3. Bottom: Distance measures between the oxygen tyrosyl group of Y53 and the guanidinium group of R41 during molecular dynamic simulations for replicates of GUK1 (black) and pGUK1 (purple). Replicates are shown iteratively. (L) Immunoblot analysis of anti-FLAG IP and WCL samples for indicated proteins in 293T cells ectopically co-expressing WT GUK1 or indicated GUK1 mutants with EML4-ALK. (M) GUK1 enzyme activity of the corresponding anti-FLAG IP from 293T cells in L. Data (B-I) represent ≥ two independent experiments and graphs display mean +/− SD (ns p≥0.05, *p<0.05, **p<0.01, ***p<0.001, ****p<0.0001). Statistical significance was assessed by Student’s t-test. See also Figure S2.
Figure 3.
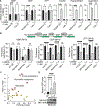
Figure 3.. ALK inhibition decreases GDP synthesis.
(A) Relative levels of purine metabolites with or without treatment of lorlatinib (1 μM) for 6 hours in the indicated cell line (n=5). (B) Contribution of 15N5-guanine to M+5 GMP, GDP, and GTP in the indicated cells with or without treatment of lorlatinib (1 μM) for 1 hour (n=6). (C) Identification of impacted metabolic pathways in BEAS-2B cells with stable expression of EML4-ALK fusion kinase. Pathway enrichment analysis (p-values) and pathway topology analysis (pathway impact) were performed using the MetaboAnalyst 5.0 software package. (D) Relative GDP levels in BEAS-2B cells stably expressing vector control or EML4-ALK fusion kinase with two different expression levels (n=5). The corresponding western blot analysis is shown at the bottom. Graphs display mean +/− SD (ns p≥0.05, *p<0.05, **p<0.01, ***p<0.001, ****p<0.0001). See also Figure S3.
Figure 4.
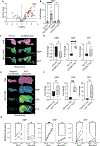
Figure 4.. Oncogenic ALK increases guanine nucleotides in vivo.
(A) Volcano plot showing changes in metabolite levels in tumors from Ad-EML4-ALK-infected mice compared to control Ad-Cre-infected mice analyzed by LC-MS. Purine nucleotide metabolites highlighted in red (n=9). (B) Relative GDP levels from murine tumors from indicated mice and treatments (n=9 Ad-Cre and EML4-ALK, n=5 saline and AAV9-Cre). (C,D) Murine lung MALDI MSI for indicated metabolites from mice infected with Ad-Cre (control) or Ad-EML4-ALK (C). Bar graphs (D) showing relative levels of indicated metabolites (n=4 control, n=6 EML4-ALK). (E, F) Human lung MALDI MSI for indicated metabolites from biopsied ALK+ tumor specimens and patient-matched adjacent normal lung (E). Bar graphs (F) showing relative levels of indicated metabolites (n=4). (G) Graphs showing metabolite abundance of indicated metabolites from ALK+ and non-ALK biopsied tumors (n=4). Graphs display mean +/− SD (ns p≥0.05, *p<0.05, **p<0.01, ***p<0.001, ****p<0.0001). See also Figure S4.
Figure 5.
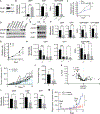
Figure 5.. ALK-mediated GUK1 phosphorylation is important for tumor proliferation.
(A) Western blot analysis of vector control (vec) and GUK1 KO in MGH045–1 patient-derived cell line. (B) Levels of indicated metabolites from control and GUK1 KO MGH045–1 cells and ratio of GDP/GMP (n=6). (C) Percentage cell proliferation normalized to day 0 for MGH045–1 cells stably infected with vector control (vec) and sgRNA #1 against GUK1 (n=6). (D) Western blot analysis of MGH045–1 cells treated with indicated TKIs at 1uM concentration for 1 h. Osi: Osimertinib. (E) Western blot analysis of GUK1 knockout MGH045–1 cells stably expressing WT GUK1 or Y74F (YF) GUK1 treated with or without 1uM lorlatinib for 1 h. (F) Levels of indicated metabolites and ratios from GUK1 knockout with WT GUK1 or Y74F (Y74F) GUK1 rescue cells (n=6). (G) Percentage cell proliferation normalized to day 0 for MGH045–1 cells (5E) with GUK1 knockout and stably infected with WT GUK1 or Y74F (Y74F) GUK1 (n=6). (H) Levels of indicated metabolites and ratios from WT GUK1 or Y74F (Y74F) GUK1 KO cells treated with DMSO 1uM lorlatinib for 1h (n=6). (I) Tumor growth curves of NSG mice inoculated with patient-derived ALK+ NSCLC cells with GUK1 KO rescued with WT GUK1 or Y74F (YF) GUK1. Data represent ≥ two independent experiments with ≥ 5 mice per group. (J) Bar graph depicting weights from dissected tumors at day 30 after implantation. Data represent ≥ two independent experiments with ≥ 5 mice per group. (K, L) Volcano plot and bar graphs of indicated metabolites from LC-MS analysis of metabolites in patient-derived xenografts containing GUK1 WT or GUK1 Y74F (n=7 WT, n=8 YF). (M) Tumor growth curves of NSG mice inoculated with patient-derived ALK+ NSCLC cells 919–5 with GUK1 KO rescued with WT GUK1 or Y74F (YF) GUK1 treated with lorlatinib by oral gavage. Lorlatinib treatment was stopped after day 29. Data represent two independent experiments with n=5–7 mice per group. Graphs display mean +/− SD. Statistical significance was assessed by Student’s t-test (B, C). (ns p≥0.05, *p<0.05, **p<0.01, ***p<0.001, ****p<0.0001). See also Figure S5.
Figure 6.
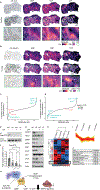
Figure 6.. GUK1 phosphorylation spatially correlates with GDP in ALK+ patient tumors and regulates MAPK signaling through Ras-GTP loading.
(A,B) Top rows: spatial MALDI MSI for indicated metabolites. Middle rows: overlay of ALK+ IHC (A) or pGUK IHC (B) and indicated metabolites. White outline indicates ALK+ or pGUK1+ IHC stain. Bottom rows: zoomed-in area of a region of interest (ROI). (C,D) Ranking plot of 2,256 metabolites detected in untargeted MALDI-MSI and their correlations to spatial detection of ALK IHC (left) or pGUK1 IHC staining (right). (E,F,G) MGH045–1 ALK+ patient-derived NSCLC cell lines expressing either WT or Y74F (YF) GUK1 were treated without or with Lorlatiinb (1uM) for 1h. Cell lysates were normalized for protein concentration and an aliquot taken for Ras-GTP immunoprecipitation (E) or subjected to immunoblot (G). Bar graph showing densitometry measurements from five and three independent Ras-GTP immunoprecipitation experiments, without and with lorlatinib, respectively. Bar graph displays mean +/− SD. Statistical significance assessed with ordinary one-way ANOVA. (ns p>0.05, *p≤0.05, **p≤0.01). (H, I) Hierarchical clustering heatmap (H) and pattern analysis of the cluster indicated by the black box in H (I) for phosphorylated proteins identified in phosphoproteomic analysis in MGH045–1 ALK+ patient-derived NSCLC GUK1KO cell lines expressing either WT or Y74F (YF), treated with DMSO or lorlatinib for 1 h. (J) Top 10 pathways from REACTOME pathway enrichment of 919 phosphoproteins identified in cluster in (I). (K) Schematic showing ALK-mediated phosphorylation of GUK1 modulates MAPK signaling through GDP/GTP availability and Ras-GTP loading. GMP: guanosine monophosphosphate, GDP: guanosine diphosphate, GTP: guanosine triphosphate. See also Figure S6.
Figure 7.
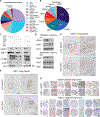
Figure 7.. Several oncogenic fusion kinases in lung cancer phosphorylate GUK1.
(A,B) Spectrum of frequencies of oncogenic driver alterations across 7,443 lung adenocarcinoma samples from cBioPortal. Fusion kinases are demarcated by the black curved line and frequencies of fusion kinases are shown in the right pie chart. (C) In vitro kinase assay using recombinant proteins GUK1, ALK, ROS1, and RET as specified in the presence or absence of kinase inhibitor, lorlatinib (1uM) or selpercatinib (1uM). (D) Patient-derived cell lines were isolated from ROS1 (top) or RET fusion-positive (bottom) NSCLC patients, treated with DMSO or kinase inhibitor (lorlatinib 1uM or selpercatinib 1uM) for 1h, and subjected to SDS-PAGE immunoblot. (E, F) IHC for pGUK and GUK1 on treatment-naïve FFPE samples from patients with ROS1 or RET fusion-positive NSCLC. ROS1+ NSCLC biopsy site: cerebellum. RET+ NSCLC biopsy site: lymph node. (G) IHC on tissue microarray of lung adenocarcinoma specimens that exhibit positive or negative staining for pGUK1. See also Figure S7.

References

    1. Thai AA, Solomon BJ, Sequist LV, Gainor JF, and Heist RS (2021). Lung cancer. Lancet 398, 535–554. 10.1016/S0140-6736(21)00312-3. - DOI - PubMed
    1. Siegel RL, Miller KD, and Jemal A (2020). Cancer statistics, 2020. CA Cancer J Clin 70, 7–30. 10.3322/caac.21590. - DOI - PubMed
    1. Kris MG, Johnson BE, Berry LD, Kwiatkowski DJ, Iafrate AJ, Wistuba II, Varella-Garcia M, Franklin WA, Aronson SL, Su PF, et al. (2014). Using multiplexed assays of oncogenic drivers in lung cancers to select targeted drugs. JAMA 311, 1998–2006. 10.1001/jama.2014.3741. - DOI - PMC - PubMed
    1. Pan X, Lv T, Zhang F, Fan H, Liu H, and Song Y (2018). Frequent genomic alterations and better prognosis among young patients with non-small-cell lung cancer aged 40 years or younger. Clin Transl Oncol 20, 1168–1174. 10.1007/s12094-018-1838-z. - DOI - PubMed
    1. Lin JJ, Riely GJ, and Shaw AT (2017). Targeting ALK: Precision Medicine Takes on Drug Resistance. Cancer Discov 7, 137–155. 10.1158/2159-8290.CD-16-1123. - DOI - PMC - PubMed

LinkOut - more resources