. 2025 Feb 7;16(1):1440.
doi: 10.1038/s41467-025-56554-x.

Mélange dehydration and melting beneath South Sandwich Islands arc

Affiliations

Mélange dehydration and melting beneath South Sandwich Islands arc

Yunchao Shu et al. Nat Commun. .

Abstract

Mechanisms regulating material transfer from subducted slabs to arc magmas remain debated, centered on metasomatized mantle wedge interactions versus mélange mobilization at the slab-mantle interface. The South Sandiwch Islands arc offers a unique setting to distinguish between these models due to the significant barium isotope contrast between altered oceanic crust and sediments, the latter displaying unusually light barium isotope compositions compared to the global sediment range. Here we show substantial barium isotope variations coupled with invariant strontium isotope ratios in arc lavas, consistent with mélange mobilization beneath the arc. Northern arc lavas display a broader range of barium isotope values than expected from slab inputs, suggesting barium isotope fractionation during slab material transport, potentially driven by phengite-related barium retention within the mélange. Notably, sediments, rather than altered oceanic crust, emerge as the dominant source of barium in arc lavas. While a comparison of barium isotope data from four additional arcs indicates mantle wedge metasomatism remains visible in several cases, mélange mobilization is consistent with available data across all of these subduction zones.


Conflict of interest statement

Competing interests: The authors declare no competing interests.

Figures

Fig. 1
Fig. 1. Schematic illustration of Ba isotopes vs Sr isotopes to distinguish the two different end-member models of slab material transport in subduction zones.
A In the metasomatized mantle wedge model, sediment and AOC (yellow and blue boxes, respectively), which both potentially show fractionated Ba isotope characteristics upon melting and dehydration, respectively (orange and blue horizontal lines extending from boxes), mix with the mantle wedge to form arc magmas. Orange and blue lines represent mixing lines between mantle wedge and sediment melts and between mantle wedge and AOC fluids, respectively. Yellow and blue diamonds represent arc magmas produced by the mixing of sediment melts and AOC fluids, respectively, with DMM. B In the mélange model, sediment, AOC, and the mantle wedge physically mix to form hybrid mélange rocks with a Sr isotope ratio determined by the relative proportions of the components that formed the mélange. The mélange subsequently melts and/or dehydrates to form arc magmas with fractionated Ba isotope signatures. A mixing line between sediment and AOC (purple dashed line) is shown. Purple dotted lines represent mixing lines between the mantle wedge and subducted slab components with different proportions of sediment and AOC. The purple area indicates mélange compositions. Purple diamonds represent arc magmas generated from mélange melting and dehydration. Data sources of the DMM,,,,, sediment,,–, and AOC,,– are all from literature (see text for details).
Fig. 2
Fig. 2. Location of South Sandwich Islands (SSI) subduction zone and Ba isotope characteristics in the SSI arc.
A Location of SSI arc and surrounding areas. B Map of the SSI arc volcanoes. Also shown is the location of two sediment cores from which samples were analyzed in this study to constrain the composition of the sediment input to the arc. The black dashed line represents the propagation of the Bullard fraction zone, which divides the SSI arc into northern and southern sections. The approximate plate motion direction is represented by a white arrow. C Regional variations in Ba isotope systematics with latitude along the SSI arc. Also shown are the Ba isotope compositions of the DMM (δ138/134Ba = +0.03 to +0.12‰),,, AOC (δ138/134Ba = +0.20 ± 0.10‰),, and sediments (this study) (see text for details). Error bars associated with the δ138/134Ba values represent 2 standard deviations (SD) of sample reproducibility. The image of the landform was made with GeoMapApp 3.6.10 (www.geomapapp.org)/CC BY/CC BY. Source data are provided as a Source Data file.
Fig. 3
Fig. 3. Strontium, Nd, and Pb isotope characteristics for the South Sandwich Islands (SSI) arc lavas.
Plots of A Sr isotopes against Nd isotopes and B 206Pb/204Pb versus 208Pb/204Pb for the SSI arc lavas. Data for the DMM and AOC components are from the literature, and data for sediments are from this study. Mixing lines between the DMM and bulk sediments (yellow bold lines) and between the DMM and bulk AOC (blue bold line) are also shown. Numbers in mixing lines represent sediment or AOC additions by weight. Data of DMM, AOC, and sediment endmembers used for calculation in this figure are shown in Supplementary Table 6. Note that the legend colors follow that of the map in Fig. 2 and are the same for all subsequent figures with lavas from multiple locations. Source data are provided as a Source Data file.
Fig. 4
Fig. 4. Barium and Sr isotope variations for the South Sandwich Islands (SSI) arc lavas.
Mixing areas between the DMM and sediments (yellow) and between the DMM and AOC (blue) are also shown. Numbers in mixing areas represent bulk sediment or AOC additions by weight. Purple bold lines represent mixing lines between sediments and AOC. Purple dashed lines represent sediment addition to the DMM and AOC and purple dotted lines represent AOC addition to the DMM and sediment. A In the northern section, Ba and Sr isotope characteristics are consistent with the mélange model of slab material transport underneath the SSI arc. The purple area represents the addition of 1.8–3% by weight of sediments, and <15% of AOC, to the mantle wedge. B In the southern section, both the mélange model and the metasomatized mantle wedge model can account for the Ba and Sr isotope signatures for the SSI arc. The purple area represents the addition of 1.0–2.5% by weight of sediments, and <8% by weight of AOC, to the mantle wedge. Data sources for the DMM and AOC components are the same as in Fig. 1. Sediment compositions are from this study. Data of DMM, AOC, and sediment endmembers used for calculation in this figure are shown in Supplementary Table 6. Error bars associated with the δ138/134Ba values represent 2 standard deviations (SD) of sample reproducibility. Source data are provided as a Source Data file.
Fig. 5
Fig. 5. Barium and Sr isotope variations for Tonga, Kermadec, Aleutian, and Ryukyu arcs.
Mixing areas between the DMM and sediments (yellow) and between the DMM and AOC (blue) are also shown. Numbers in mixing areas represent bulk sediment or AOC additions by weight. Purple bold lines represent mixing lines between sediments and AOC. Purple dashed lines represent sediment addition to the DMM and AOC and purple dotted lines represent AOC addition to the DMM and sediment. A The purple area represents addition of 0.1–0.65% by weight of sediments, and <5% by weight of AOC, to the mantle wedge. B The purple area represents addition of 0.15–1.7% by weight of sediments, and <3% by weight of AOC, to the mantle wedge. C The purple area represents addition of 0.05–0.45% by weight of sediments, and <3% by weight of AOC, to the mantle wedge. D The purple area represents addition of 0.35–2.2% by weight of sediments to the mantle wedge. Data sources for the DMM and AOC (AC) components are the same as in Fig. 1. Arc lava and sediment compositions in (A, B), (C),, and (D),, as well as AOC data in (D),, are from previous studies. Data of DMM, AOC, and sediment endmembers used for calculation in this figure are shown in Supplementary Table 7. Error bars associated with the δ138/134Ba values represent 2 standard deviations (SD) of sample reproducibility.
Fig. 6
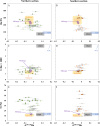
Fig. 6. Trace element and Ba isotope compositions in the South Sandwich Islands (SSI) arc lavas indicate breakdown of different minerals at subarc depths.
Barium isotope compositions plotted versus Ba/Th, U/Ba, and Sr/Nd for northern (A, C, E) and southern (B, D, F) parts of SSI arc lavas. Data sources for the DMM, AOC, and sediment components are the same as in Fig. 4. Also shown are source compositions (purple areas) calculated by similar contributions of sediment and AOC to the DMM as in Fig. 4 underneath the northern and southern parts of the SSI arc. Error bars associated with the δ138/134Ba values represent 2 standard deviations (SD) of sample reproducibility. Source data are provided as a Source Data file.

References

    1. Ishikawa, T. & Nakamura, E. Origin of the slab component in arc lavas from across-arc variation of B and Pb isotopes. Nature370, 205–208 (1994).
    1. Elliott, T., Plank, T., Zindler, A., White, W. & Bourdon, B. Element transport from slab to volcanic front at the Mariana arc. J. Geophys. Res. Solid Earth102, 14991–15019 (1997).
    1. Kessel, R., Schmidt, M. W., Ulmer, P. & Pettke, T. Trace element signature of subduction-zone fluids, melts and supercritical liquids at 120–180 km depth. Nature437, 724–727 (2005). - PubMed
    1. Nielsen, S. G. & Marschall, H. R. Geochemical evidence for mélange melting in global arcs. Sci. Adv.3, e1602402 (2017). - PMC - PubMed
    1. Spandler, C. & Pirard, C. Element recycling from subducting slabs to arc crust: a review. Lithos170-171, 208–223 (2013).

LinkOut - more resources