. 2025 Feb 7;16(1):1429.
doi: 10.1038/s41467-025-56714-z.

WNT11 Promotes immune evasion and resistance to Anti-PD-1 therapy in liver metastasis

Affiliations

WNT11 Promotes immune evasion and resistance to Anti-PD-1 therapy in liver metastasis

Weiliang Jiang et al. Nat Commun. .

Abstract

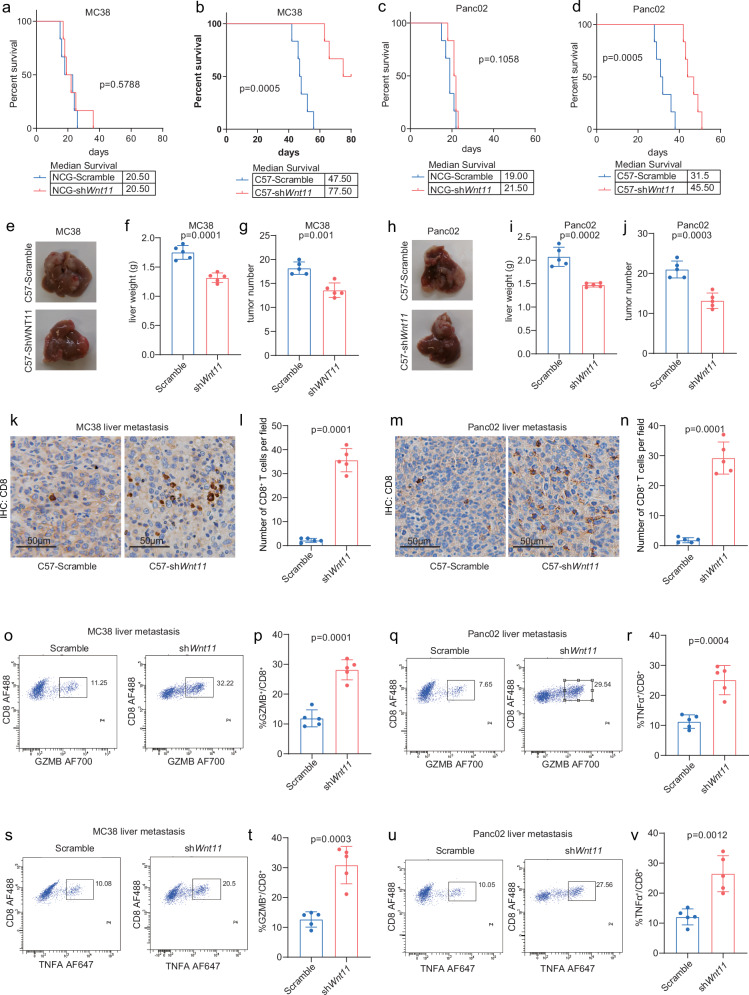
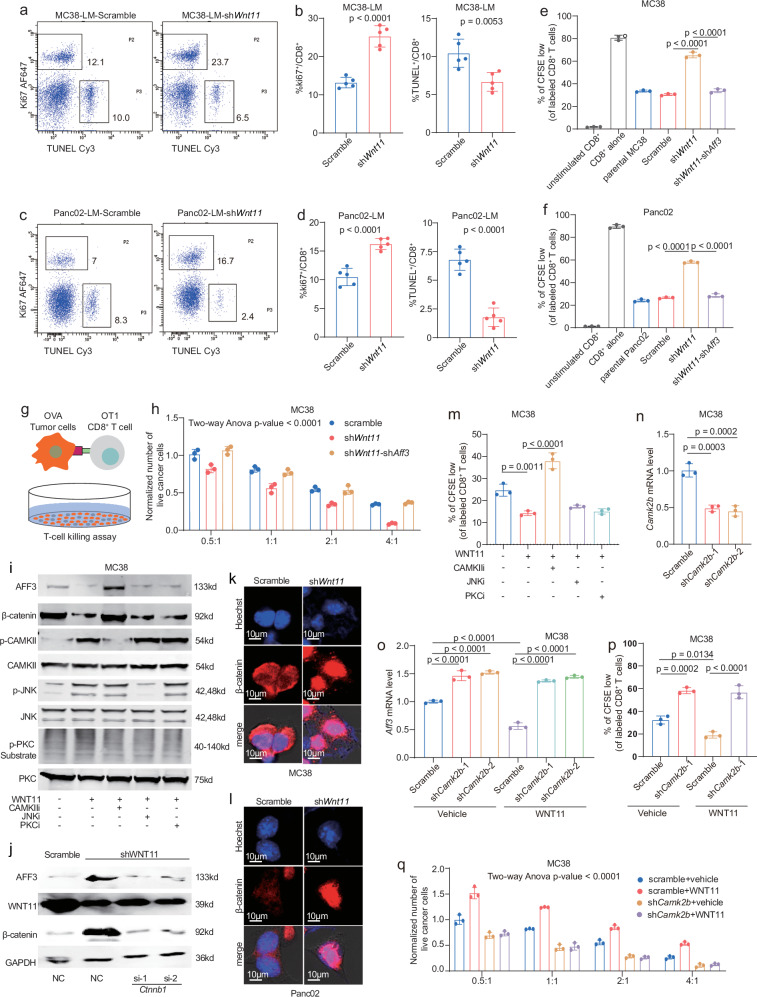
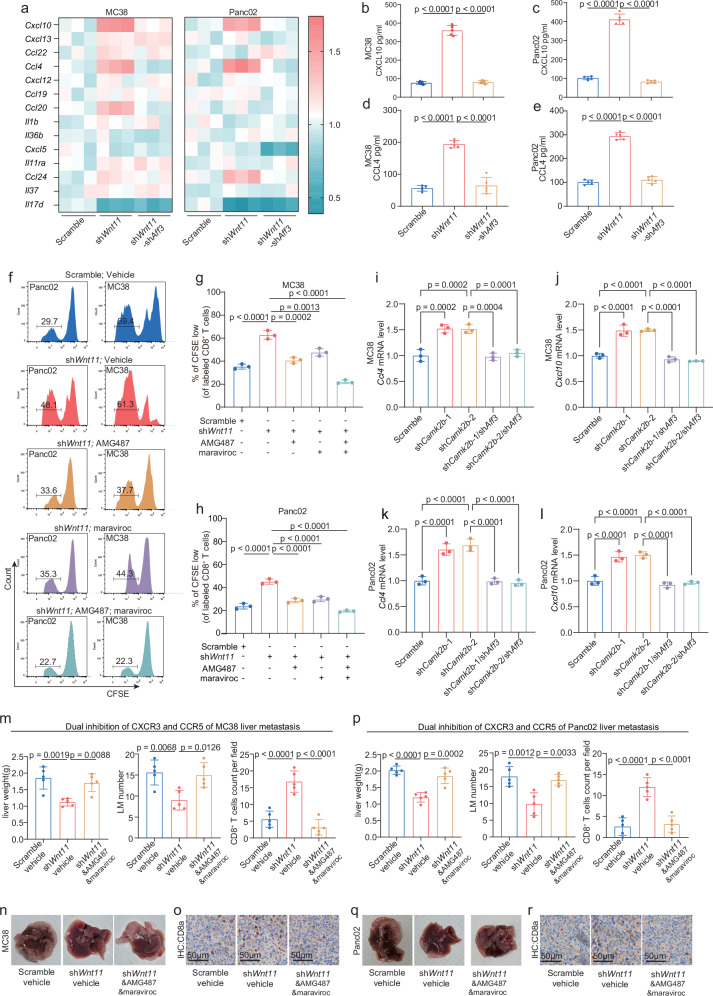
Liver metastasis (LM) poses a significant challenge in cancer treatment, with limited available therapeutic options and poor prognosis. Understanding the dynamics of tumor microenvironment (TME) and immune interactions is crucial for developing effective treatments. We find that WNT11 promoted CD8+ T-cell exclusion and suppression, which was correlated with poor prognosis in LM. Mechanistically, WNT11-overexpressing tumor cells directly reduce CD8+ T-cell recruitment and activity by decreasing CXCL10 and CCL4 expression through CAMKII-mediated β-catenin/AFF3 downregulation. WNT11-overexpressing tumor cells promote immunosuppressive macrophage polarization by inducing IL17D expression via the CAMKII/NF-κB pathway, which result in CD8+ T-cell suppression. Moreover, CAMKII inhibition increases the efficacy of anti-PD-1 therapy in mouse model of LM. Serum expression of WNT11 is identified as a potential minimally invasive biomarker in the management of colorectal cancer-LM with immunotherapy. Our findings highlight WNT11/CAMKII axis as a critical regulator of the TME and a promising target for immunotherapy in patients with LM.


Conflict of interest statement

Competing interests: The authors declare no competing interests.

Figures

Fig. 1
Fig. 1. WNT11 is associated with CD8 + T-cell exclusion and a poor prognosis in patients with liver metastases.
a The correlation between the GSVA score of the KEGG WNT Signaling Pathway gene set and the expression of CD3D and CD8A in the LM cohort (n = 86). b The association between genes in the WNT signaling pathway and the clinical prognosis in the LM cohort. c, d Overall survival according to AFF3 and WNT11 expression in the LM cohort. e Pearson correlation analysis of AFF3 levels with WNT11 levels in the LM cohort. f Liver metastases in the LM cohort were divided into four groups based on the expression of AFF3 and WNT11. The plot shows the proportion of cancer types in the different groups. g, h The expression of CD3D and CD8A in the above four groups. i, j AFF3 and WNT11 IHC staining of primary tumors and matched liver metastases in the FUSCC_CRC_cohort (n = 71) and the SGH_PDAC_cohort (n = 50). kn Tissue microarray analysis of AFF3 and WNT11 expression in primary tumors and matched liver metastases from the FUSCC_CRC_cohort (k, l n = 71) and SGH_PDAC_cohort (m, n n = 50). or Overall survival based on AFF3 and WNT11 expression in the FUSCC_CRC_cohort (o, p) and SGH_PDAC_cohort (q, r). s, t Pearson correlation of AFF3 with WNT11 expression in the FUSCC_CRC_cohort (s) and SGH_PDAC_cohort (t). a, e, s, t P-values and r-values were determined using Pearson correlation (two-tailed) without adjustment. b P-values were determined using univariate proportional hazard analysis without adjustment. c, d, or P-values were determined using a log-rank test. g, h P-values were determined using a one-way ANOVA followed by a post hoc Tukey’s multiple comparison test. kn P-values were determined using a Wilcoxon rank-sum test (two-tailed). g, h, kn In the box plots, the bounds of the box span from 25% to 75% percentile, the line represents the median, and the whiskers show the minima and maxima of data points. Source data are provided as a Source Data file.
Fig. 2
Fig. 2. Knockdown of WNT11 in cancer cells impairs tumor growth and improves survival via the adaptive immune system in immunocompetent mice.
ad Overall survival of immunodeficient NCG or immunocompetent C57BL/6 mice bearing liver metastases seeded with MC38 and Panc02 scramble or shWnt11 cancer cells. n = 6 mice per group. e Gross appearance of MC38 scramble and shWnt11 liver metastases. f, g The liver weight and the number of metastases per liver in the MC38 LM mouse model. h Gross appearance of Panc02 scramble and shWnt11 liver metastases. i, j The liver weight and the number of metastases per liver in the Panc02 LM mouse model. kn Comparison of CD8+ T-cell infiltration in the MC38 (k, l) and Panc02 (m, n) LM mouse model between the scramble and shWnt11 groups. or FACS analysis to determine the frequency of GZMB + CD8 + T-cells relative to the total CD8 + T-cell population in MC38 (o, p) and Panc02 (q, r) liver metastases. sv FACS analysis to determine the frequency of TNFα + CD8 + T-cells relative to the total CD8 + T-cell population in MC38 (st) and Panc02 (u, v) liver metastases. ad Statistics of survival by Kaplan-Meier test (two-tailed). f, g, i, j, l, n, p, r, t, v. Data are presented as the mean ± SD (n = 5 biological replicates). P-values were calculated using a Student’s t test (two-tailed). Source data are provided as a Source Data file.
Fig. 3
Fig. 3. CD8+ T-cells are increased and CD206+ macrophages are decreased in the microenvironment of MC38 liver metastases following WNT11 knockdown.
a t-SNE plot illustrating the distribution of all CD45 + immune cells from liver metastases of MC38 cells with scramble control or WNT11 knockdown. b Proportion of differential cell clusters between MC38 scramble and shWnt11 liver metastases. c t-SNE plot of all CD45+ cells colored by the expression levels of CD206 in the scramble and shWnt11 group. d Comparison of CD206 expression of C02 between the scramble and shWnt11 group. e Comparison of I-A/I-E and CD24 expression of C16 between the scramble and shWnt11 group. fi mIHC staining was used to verify the differences of I-A/I-E+CD8+ T-cells (f, g) and CD206+ macrophages (h, i) in MC38 liver metastases between the scramble and shWnt11 group. j CD206 expression of macrophages in MC38 liver metastases between the scramble and shWnt11 group detected using mIHC. k, l FACS analysis to determine the frequency of I-A/I-E + CD8 + T-cells relative to the total CD45 + T-cell population in MC38 liver metastases. m, n FACS analysis to determine the frequency of CD206 + F4/80 + macrophages relative to the total macrophages in MC38 liver metastases. b, gj, l, n. P-values were calculated using a Student’s t test (two-tailed). Data are presented as the mean ± SD (n = 5 biological replicates). d, e P-values were calculated using a Wilcoxon rank-sum test (two-tailed). Source data are provided as a Source Data file.
Fig. 4
Fig. 4. WNT11 knockdown in tumor cells stimulates CD8+ T-cell proliferation and CD8+ T-cell-mediated tumor cell killing via AFF3.
ad Flow cytometry analysis of the proliferation and apoptosis of CD8+ T-cells in MC38 (a, b) and Panc02 (c, d) liver metastases between scramble and shWnt11 group. e, f FACS analysis of CD8+ T-cell proliferation (CFSE low) in cocultures with MC38 (e) or Panc02 (f) scramble and shWnt11 cancer cells. g. Schematic representation of an in vitro T-cell killing assay. OVA-expressing tumor cells were cocultured in different ratios with CD8+ T-cells isolated from OVA-specific T-cell receptor transgenic (OT1) mice that had been preactivated using an OVA peptide and IL-2 plus IL-7 treatment. h Titration assay involving coculture at different effector-to-target ratios assessing the sensitivity to cytotoxic T-cell killing of MC38-OVA scramble, shWnt11, and shWnt11-shAff3 cells. i Alterations in AFF3 and β-catenin protein levels in MC38 cells following treatment with WNT11 and inhibitors of CAMKII, JNK, and PKC as indicated. j Knockdown of β-catenin abrogated the AFF3-induced increase in expression following Wnt11 knockdown. k, l Knockdown of WNT11 increased the nuclear translocation of β-catenin. m FACS analysis of CD8+ T-cell proliferation (CFSE low) in cultured with conditioned media derived from MC38 cells treated with WNT11 and CAMKII, JNK, and PKC inhibitors as indicated. n qPCR analysis of the expression of Camk2b in MC38 cells following CAMKII knockdown. o Aff3 mRNA levels were detected using qPCR in MC38 cells following CAMKII knockdown and WNT11 treatment as indicated. p FACS analysis of CD8+ T-cell proliferation (CFSE low) in cultured with conditioned media derived from MC38 cells with CAMKII knockdown and WNT11 treatment as indicated. q Titration assay involving coculture at different effector-to-target ratios assessing the sensitivity to cytotoxic T-cell killing of MC38-OVA scramble and shCamk2b cells with or without WNT11 treatment. b, d P-values were calculated using a Student’s t test (two-tailed), n = 5 biological replicates. e, f, mp P-values were calculated using a one-way ANOVA followed by a Tukey’s multiple comparison test, n = 3 biological replicates. h, q P-values were calculated using a two-way ANOVA, n = 3 biological replicates. Data are presented as the mean ± SD. Source data are provided as a Source Data file.
Fig. 5
Fig. 5. WNT11 knockdown in cancer cells promotes T-cell activation and consequent antitumor immunity through CXCL10/CXCR3 and CCL4/CCR5.
a The expression of cytokines was confirmed using qPCR in MC38 and Panc02 scramble, shWnt11, and shWnt11-shAff3 cells. be ELISA was used to measure the secretion of CXCL10 and CCL4 in the supernatants of MC38 and Panc02 scramble, shWnt11, and shWnt11-shAff3 cells. fh FACS analysis of CD8+ T-cell proliferation (CFSE low) in cocultures with MC38 and Panc02 scramble and shWnt11 cells, while CXCR3 and CCR5 were inhibited by AMG487 and maraviroc, respectively, in the coculture system. il Cxcl10 and Ccl4 expression were detected using qPCR in MC38 and Panc02 cells with CAMKII knockdown or double knockdown of CAMKII and AFF3. mo Quantification and representative images of liver weight, number of metastases, and IHC staining of CD8a in an LM mouse model established using MC38 cells treated with a combination of a CXCR3 inhibitor (AMG487) and CCR5 inhibitor (maraviroc). pr Quantification and representative images of liver weight, number of metastases, and IHC staining of CD8a in an LM mouse model established using Panc02 cells treated with a combination of AMG487 and maraviroc. be, gm, p P-values were calculated using a one-way ANOVA followed by a post hoc Tukey’s multiple comparison test, data are presented as the mean ± SD (n = 3 biological replicates). Source data are provided as a Source Data file.
Fig. 6
Fig. 6. WNT11 promotes polarization of CD206+ macrophages via an IL17D-CD93 axis in liver metastases.
a, b FACS analysis confirmed the infiltration of CD86+ CD80+ macrophages and CD206+CD163+ macrophages in MC38 scramble and shWNT11 liver metastases. c, d FACS analysis confirmed the infiltration of CD86+ CD80+ macrophages and CD206+CD163+ macrophages in Panc02 scramble and shWNT11 liver metastases. e, f The effects of IL17D on M2 polarization (Mrc1, Arg1) of macrophages. g, h Conditioned media from MC38 scramble and shIl17d cells treated with WNT11 was used to culture BMDMs. The expression of M2 markers (Mrc1, Cd163) was detected using qPCR. i, j BMDMs transfected with siRNA targeting Il17ra or Cd93 were cultured with conditioned medium from MC38 cells treated with vehicle or WNT11. Flow cytometry analysis was used to detect CD206 expression in the BMDMs treated with the conditioned medium. k, l Cd93f/f, and Cd93ΔMAC BMDMs were cultured with conditioned medium from MC38 cells treated with vehicle or WNT11. m, n Representative images and quantification of liver weight, number of metastases, and mIHC analysis of CD206+ macrophage infiltration in the mouse LM model established using MC38 cells in Cd93f/f and Cd93ΔMAC mice. o, p mRNA levels and secretion of IL17D were detected in MC38 cells following Rela knockdown. q Western blotting was used to detect alterations in IL17D, NF-κB p65, p-IKKα, and IκBα protein expression levels in MC38 cells following WNT11 knockdown or WNT11 treatment. r NF-κB p65 distribution was examined in nuclear and cytoplasmic extracts from MC38 cells treated with vehicle, WNT11, and WNT11/CAMKII-IN−1 treatments. b, d, m, n P-values were calculated using a Student’s t test (two-tailed), n = 5 biological replicates. eh, j, l, o, p P-values were calculated using a one-way ANOVA followed by Tukey’s multiple comparison test, n = 3 biological replicates. Data are presented as the mean ± SD. Source data are provided as a Source Data file.
Fig. 7
Fig. 7. CAMKII antagonist potentiates the efficacy of anti-PD−1 therapy in a mouse LM model.
a, b Anti-PD−1 and CAMKII antagonist KN93 treatment in mice bearing MC38 liver metastases. Tumor progression was monitored post-tumor cell inoculation using live animal bioluminescent imaging. c, d Quantification of the liver weight and number of metastases in the mouse LM model established using MC38 cells in each group at the endpoint. e, f Anti-PD-1 and CAMKII antagonist (KN93) treatment in mice bearing KPC liver metastases. Tumor progression was monitored post-tumor cell inoculation using live animal bioluminescent imaging. g, h Quantification of the liver weight and number of metastases in the mouse LM model established using KPC cells in each group at the endpoint. i, j mIHC staining of I-A/I-E, CD8, CD206, and F4/80 in the sections of MC38 (i) and KPC (j) liver metastases in each group. k, l The mRNA expression levels of CXCL10, CCL4, and IL17D in tissues of MC38 (k) and KPC (l) liver metastases in each group. m Representative abdominal MRI images of responder and non-responder to immunotherapy before and after treatment. nq ELISA analysis of WNT11, CXCL10, CCL4, and IL17D levels in serum samples from responder (n = 10) and non-responder (n = 10) mice to immunotherapy. r Schematic representation of the WNT11-mediated immunosuppressive mechanism in liver metastases. bd, fh, k, l P-values were calculated using a one-way ANOVA followed by a post hoc Tukey’s multiple comparison test, data are presented as the mean ± SD, n = 5 biological replicates. nq P-values were calculated using a Student’s t test(two-tailed), in the box plots, bounds of the box spans from 25% to 75% percentile, the line represents the median, and the whiskers show minima and maxima of data points. Source data are provided as a Source Data file.

References

    1. Tsilimigras, D. I. et al. Liver metastases. Nat. Rev. Dis. Prim.7, 1–23 (2021). - PubMed
    1. Petrowsky, H. et al. Modern therapeutic approaches for the treatment of malignant liver tumours. Nat. Rev. Gastroenterol. Hepatol.17, 755–772 (2020). - PubMed
    1. Ciner, A. T., Jones, K., Muschel, R. J. & Brodt, P. The unique immune microenvironment of liver metastases: Challenges and opportunities. Semin. Cancer Biol.71, 143–156 (2021). - PubMed
    1. Yu, J. et al. Liver metastasis restrains immunotherapy efficacy via macrophage-mediated T cell elimination. Nat. Med.27, 152–164 (2021). - PMC - PubMed
    1. Kasi, P. M. et al. Circulating tumor DNA (ctDNA) serial analysis during progression on PD−1 blockade and later CTLA-4 rescue in patients with mismatch repair deficient metastatic colorectal cancer. J. Immunother. Cancer10, e003312 (2022). - PMC - PubMed

MeSH terms

Substances