. 2025 Feb 7;16(1):1087.
doi: 10.1038/s41467-025-56151-y.

Targeting eEF1A reprograms translation and uncovers broad-spectrum antivirals against cap or m6A protein synthesis routes

Affiliations

Targeting eEF1A reprograms translation and uncovers broad-spectrum antivirals against cap or m6A protein synthesis routes

Elisa Molina Molina et al. Nat Commun. .

Abstract

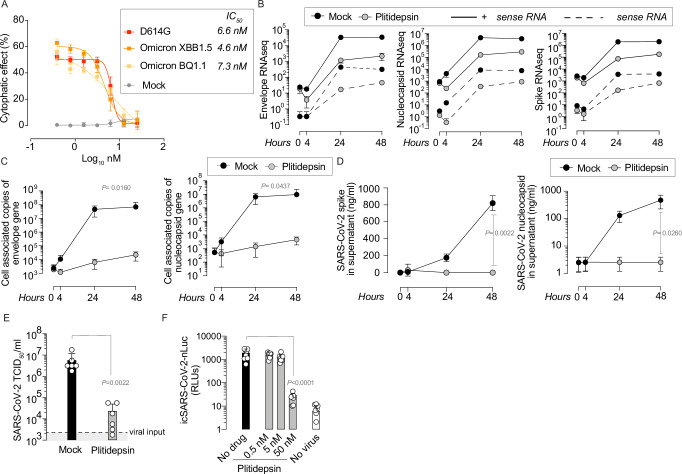
Plitidepsin is an antitumoral compound safe for treating COVID-19 that targets the translation elongation factor eEF1A. Here we detect that plitidepsin decreases de novo cap-dependent translation of SARS-CoV-2 and non-viral RNAs but affects less than 13% of the host proteome, thus preserving cellular viability. In response to plitidepsin, cells upregulate EIF2AK3 and proteins that reduce translation, but also proteins that support proteostasis via ribosome synthesis and cap-independent translation by eIF4G2 and IGF2BP2. While plitidepsin inhibits cap- or internal ribosome entry sites (IRES)-mediated translation, its impact on N6-methyladenosine (m6A) translation is limited. In agreement, plitidepsin blocks members of Coronaviridae, Flaviviridae, Pneumoviridae and Herpesviridae families. Yet, it fails to inhibit retroviruses that exploit m6A synthesis routes and are blocked by drugs targeting IGF2BP2 m6A reader. By deciphering the molecular fingerprint of cells treated with therapies targeting translation we identify a rational approach to select broad-spectrum antivirals with potential to counteract future pandemic viruses.


Conflict of interest statement

Competing interests: P.A., J.V.-A. and N.I.–U. are inventors in a patent application related to Aplidin/Plitidepsin (EP20382821.5). N.I.–U. and C.C. have collaborated with PharmaMar Foundation as part of a scientific jury. A.L., P.A. and C.C. are PharmaMar S.A. employees or PharmaMar S.A. shareholders or both. The authors declare no other competing financial interests.

Figures

Fig. 1
Fig. 1. Plitidepsin inhibits the replication of SARS-CoV-2 omicron lineages.
A Viral-induced cytopathic effect on Vero E6 cells exposed to different SARS-CoV-2 (D614G and two Omicron variants) in the presence of increasing concentrations of plitidepsin (red, orange and yellow lines). Cytotoxic effect on cells exposed to plitidepsin in the absence of virus is also shown (gray lines). Non-linear fit to a variable response curve showing mean and S.D. from one representative experiment (n exp = 1) with 3 technical replicates (n rep = 3) out of 3 experiments, excluding data from toxic drug concentrations. The IC50 for each virus is indicated. B RNAseq effective size libraries of total reads of positive (solid lines) and negative (dotted lines) cell-associated SARS-CoV-2 transcripts. Cells were infected with D614G and treated or not with 50 nM of plitidepsin and processed for transcriptome analysis at the indicated hours post-infection. Mean and S.D. of n rep = 3. Two-way RM ANOVA test showed P < 0.001 for all genes comparing mock versus plitidepsin. C Cell-associated copies of SARS-CoV-2 genes in cells infected with D614G treated or not with 50 nM of plitidepsin at the indicated hours post-infection detected by qPCR. Two-way RM ANOVA test showed P = 0.0160 for envelope and P = 0.0437 nucleocapsid genes comparing mock versus plitidepsin. D SARS-CoV-2 spike and nucleocapsid in the supernatant of Vero E6 cells infected with D614G over time ± 50 nM of plitidepsin detected by ELISA (P = 0.0022; P = 0.0260). C and D show mean and S.D. of n exp = 3 and n rep = 6. E Infectivity of supernatants collected 48 h post SARS-CoV-2-infection from cells treated ± 50 nM of plitidepsin in triplicates (P = 0.0022). Mean TCID50/mL and S.D. of n exp = 6 and n rep = 6, where the initial viral input to infect cells is marked by the gray shaded area. F Nanoluciferase produced by Vero E6 cells infected with a SARS-CoV-2 reporter virus and treated with the indicated concentrations of plitidepsin (P < 0.0001). Mean and S.D. of n exp = 3 and n rep = 9 expressed in relative light units (RLUs). Statistical differences from D to F were assayed with a two-sided Mann–Whitney U test 48 h post-infection. Source Data file provides source data.
Fig. 2
Fig. 2. Plitidepsin decreases the early translation of SARS-CoV-2 proteins required for the late synthesis of structural viral proteins.
A Protein detection and significance obtained with a two-sided linear model adjusted with Benjamini–Hochberg false discovery rate (FDR) in SARS-CoV-2 exposed versus non-infected cells ± 50 nM plitidepsin. Volcano plots of 6533 proteins consistently detected in all assayed samples comparing Log 10 of adjusted P-values and Log 2 fold change (FC). Dotted lines indicate P = 0.05. P Significantly downregulated cellular proteins are shown in yellow dots, upregulated in blue. Gray dots represent proteins with no variation. Viral proteins are shown in red. Proteins are listed in Supplementary Data 1. B Differences in abundance (Log 2 intensity distribution) of the indicated viral proteins in cells exposed to SARS-CoV-2 (orange) and not exposed (green) ± 0.5, 5 and 50 nM of plitidepsin. Interquartile range (IQR), and first, second and third quartiles (Q) are shown. Whiskers extend 1.5 times the IQR from Q1 and Q3. Data from A and B derive from n rep = 3 analyzed for each condition tested. C Percentage of Vero E6 cells positive for dsRNA detected by FACS. Cells ± 50 nM plitidepsin were inoculated with D614G for 48 h (P = 0.0002). Data show mean and S.D. from n exp = 3 and n rep = 8. D Confocal microscopy of dsRNA (green) of Vero E6 cells treated as in C. Nuclei were labeled with DAPI (blue). Scale bar 50 µm. E Cell-associated nucleocapsid and spike content detected by ELISA in Vero E6 cells infected with D614G ± 50 nM of plitidepsin followed over time (P = 0.0022). Mean and S.D. for each timepoint of n exp = 3 and n rep = 6. C and E statistical differences were assayed with a two-sided Mann–Whitney U test 48 h post-infection. F Confocal microscopy of nucleocapsid (green) and spike (red) staining of Vero E6 cells infected with D614G ± 50 nM of plitidepsin (Scale bar 50 µm). Highlighted inset is magnified (Scale bars 25 µm). Nuclei were labeled with DAPI (blue). Source Data file provides source data.
Fig. 3
Fig. 3. Plitidepsin reduces the translation of RNAs and the synthesis of de novo proteins without affecting cellular viability.
A Expression of luciferase in Vero E6 cells transfected with lipid nanoparticles (LNP) containing ready-to-express luciferase mRNA ± 50 nM plitidepsin. Vero E6 were assayed by luminometry two days after transfection. B Expression of eGFP in Vero E6 cells transfected with LNP containing ready-to-express eGFP mRNA in the absence or presence of 50 nM plitidepsin. Vero E6 were assayed by FACS two days after transfection. C Expression of eGFP in Vero E6 cells infected with SARS-CoV-2 eGFP reporter in the absence or presence of 50 nM plitidepsin. Vero E6 were assayed by FACS two days after infection. D Relative expression of luciferase in Vero E6 cells pre-treated or not with 50 nM plitidepsin for 48 h before transfection with LNP containing ready-to-express luciferase mRNA, assayed by luminometry one day after transfection. Values were normalized to the mean RLUs of cells transfected without the drug, set at 100 %. AD show mean and S.D. of n exp = 3 and n rep = 9 (P < 0.0001). E Cellular ATP released by Vero E6 cells exposed for 48 h to the indicated plitidepsin concentrations measured by luminometry. Mean and S.D. of n exp = 4 and n rep = 12. F Cellular viability of Vero E6 cells exposed for 48 h to increasing concentrations of plitidepsin stained with live and dead staining kit by FACS. Cells were incubated with 10 % DMSO to induce mortality (P = 0.0022). G Cellular viability of Vero E6 treated as in F with 0.5, 5, and 50 nM plitidepsin and measured by MTT (P < 0.0001). F and G show mean and S.D. of n exp = 3 and n rep = 9. Statistical differences were assayed with a two-sided one sample t-test in D and with a two-sided Mann–Whitney U test in the rest of the panels. Source Data file provides source data.
Fig. 4
Fig. 4. Plitidepsin has a larger impact in SARS-CoV-2 mRNA abundance and viral protein translation than in host coding mRNAs or cellular protein synthesis.
A Host-coding RNA and positive cell-associated SARS-CoV-2 transcripts of Vero E6 cells exposed to SARS-CoV-2 at the indicated hours post-infection. B Cells were exposed to SARS-CoV-2 as in A with 50 nM plitidepsin. Transcripts are listed in Supplementary Data 2. C Log 2 fold change of cellular protein expression (yellow plots) and viral proteins (gray plots) comparing SARS-CoV-2 exposed cells treated with the indicated concentration of plitidepsin versus infected mock-treated cells. Violin plots show the median (horizontal lines) and quartiles (bottom and upper lines) 48 h post-infection. D Percentages of proteins increased (red), decreased (green) or unaffected (gray) in cells treated with 50 nM plitidepsin for 48 h found in SARS-CoV-2 exposed cells compared to non-infected untreated cells. E Molecular functions significantly enriched in proteins upregulated shown in D Protein counts within each of the molecular functions detected with a strength > 0.5 and more than 5 members are depicted. F Biological processes and cellular compartment categories significantly enriched in proteins as described in E. E and F show statistical differences and P values from two-sided enrichment test corrected with Benjamini–Hochberg FDR. G Circular plot of the connection network established between proteins mutually upregulated in cells treated with 50 nM plitidepsin in SARS-CoV-2 exposed and non-infected cells. eEF1A isoforms were also included (although they are not modified) to detect putative interactors (linked with orange lines). Purple lines show network connections. Gray-shaded areas contain purple lines whose length is proportional to the increased protein expression in SARS-CoV-2 exposed cells. External arches represent the molecular functions linked to these proteins, that have the same colors as in E Proteins not involved in the depicted functions or disconnected were not represented but are listed in Supplementary Data 3. Functions found are listed in Supplementary Data 4. Proteins in bold are functionally linked to the activity of plitidepsin. AF show data of n rep = 3 analyzed for each timepoint tested. Source Data file provides source data.
Fig. 5
Fig. 5. Plitidepsin redirects viral translation via eIF4G2 and PABC1 towards a cap-independent m6A route read by IGF2BP2.
A Expression of a bi-cistronic dual reporter plasmid that expresses firefly luciferase via a poliovirus IRES and renilla luciferase via cap-dependent translation 48 h after Vero E6 transfection ± 50 nM of plitidepsin. B Geometric mean expression (Geo Mean) of HIV-1 Gag-eGFP plasmid detected by FACS 48 h after transfection on Vero E6 cells ± 50 nM of plitidepsin (P = 0.0002). C Infection of a luciferase single-cycle infectious HIV-1 construct pseudotyped with VSVg in the presence of the indicated antivirals (P = 0.0315; P ≤ 0.0012). Vero E6 cells were pulsed with equal amount of pseudoviruses and cultured for two days to determine luciferase activity, in RLUs. D Infection of a GFP single-cycle infectious HIV-1 construct pseudotyped with VSVg in the presence of indicated antivirals for two days. Vero E6 cells were pulsed with an equal amount of pseudoviruses to determine Geo Mean GFP in HIV-1 GFP+ cells by FACS (P < 0.0001). E Representation of Biorender showing proteins upregulated by 50 nM plitidepsin involved in translation via m6A and readers identified. Graph shows infection of HIV-1 construct pseudotyped with VSVg as in C, but in the presence or absence of the indicated concentrations of CWI1-2 (P = 0.0384; P = 0.0001), tegaserod and plitidepsin (P = 0.0057). F Nanoluciferase produced by Vero E6 cells infected with a nanoluciferase SARS-CoV-2 reporter virus. Cells were treated with the indicated concentrations of CWI1-2, tegaserod and plitidepsin (P < 0.0001) and assayed by luminometry 48 h post-infection. Values are expressed in RLUs. G Fold reduction of luciferase mRNA expression on Vero E6 cells 48 h in the presence of 50 nM plitidepsin after transfection of a capped 5’ mRNA, an uncapped with 50 % of m6A (P < 0.0001) or an uncapped mRNA not modified (P = 0.0002). AG show mean and S.D. from at least n exp = 3 and n rep = 8, where statistical differences were measured with a two-sided Man–Whitney U test. HIV-1 human immunodeficiency virus type 1, VSVg vesicular stomatitis virus G protein, DTG Dolutegravir, AZT Zidovudine. Source Data file provides source data.
Fig. 6
Fig. 6. Antiviral activity of plitidepsin against other viruses.
A Dose-response curve for the anti-MERS-CoV activity (red lines) and cytotoxicity of plitidepsin (gray lines) shown as the mean and S.D. of n exp = 3 and n rep = 9 measured 3 days post-infection. B Dose-response curve for the anti-HCV replicon activity (red lines) and cytotoxicity of plitidepsin (gray lines) shown as the mean and S.D. of n exp = 3 measured 2 days post-infection. C Dose-response curve for the anti-ZIKV activity (red lines) and cytotoxicity of plitidepsin (gray lines) shown as the mean and S.D. of n exp = 3 measured 5 days post-infection. D Dose-response curve for the anti-HSV activity (red lines) and cytotoxicity of plitidepsin (gray lines) shown as the mean and S.D. of n exp = 3 measured 2 days post-infection. E Dose-response curve for the anti-RSV activity (red lines) and cytotoxicity of plitidepsin (gray lines) shown as mean and S.D. of n exp = 3 and n rep = 9 measured 3 days post-infection. F Dose-response curve for the anti-HIV-1 activity (red lines) and cytotoxicity of plitidepsin (gray lines) shown as the mean and S.D. of n exp = 3 measured 5 days post-infection. AF The IC50 value is also indicated. MERS-CoV Middle East respiratory syndrome coronavirus, HCV hepatitis C virus, ZIKV Zika virus, HSV herpes simplex virus, RSV respiratory syncytial virus, HIV-1 human immunodeficiency virus type 1. Source Data file provides source data.

References

    1. Zumla, A. et al. Host-directed therapies for infectious diseases: current status, recent progress, and future prospects. Lancet Infect. Dis.16, e47–e63 (2016). - PMC - PubMed
    1. Kaufmann, S. H. E., Dorhoi, A., Hotchkiss, R. S. & Bartenschlager, R. Host-directed therapies for bacterial and viral infections. Nat. Rev. Drug Discov.17, 35–56 (2018). - PMC - PubMed
    1. Baggen, J., Vanstreels, E., Jansen, S. & Daelemans, D. Cellular host factors for SARS-CoV-2 infection. Nat. Microbiol. 1219–1232, 10.1038/s41564-021-00958-0 (2021). - PubMed
    1. Liu, L. et al. Striking antibody evasion manifested by the Omicron variant of SARS-CoV-2. Nature602, 676–681 (2022). - PubMed
    1. Normile, D. Philanthropist donates $172 million to speed up drug development for the next pandemic (Scienceinsider, 2022).

MeSH terms

LinkOut - more resources