. 2025 Feb 7;11(1):25.
doi: 10.1038/s41522-025-00650-9.

Personalized prediction of glycemic responses to food in women with diet-treated gestational diabetes: the role of the gut microbiota

Affiliations

Personalized prediction of glycemic responses to food in women with diet-treated gestational diabetes: the role of the gut microbiota

Polina V Popova et al. NPJ Biofilms Microbiomes. .

Abstract

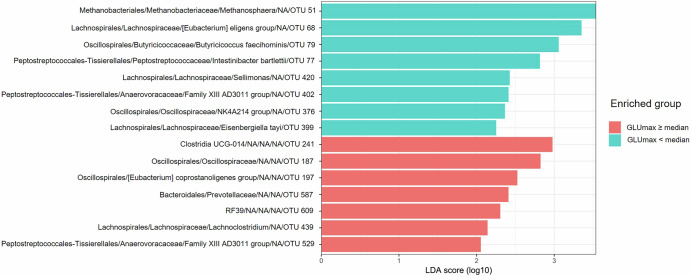
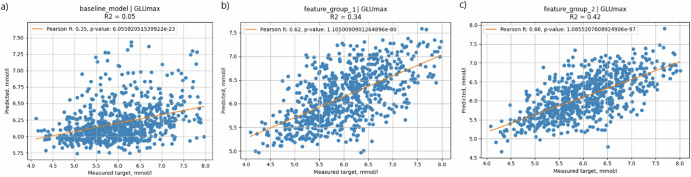
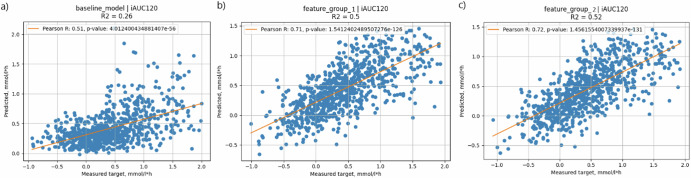
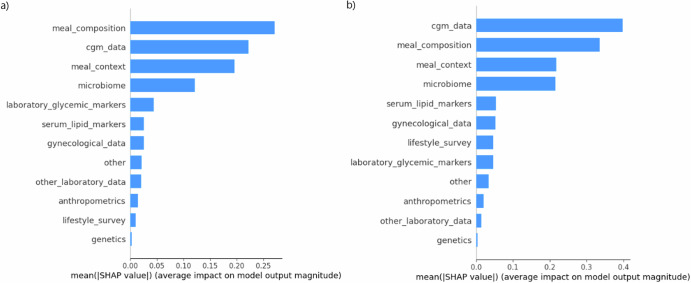
We developed a prediction model for postprandial glycemic response (PPGR) in pregnant women, including those with diet-treated gestational diabetes mellitus (GDM) and healthy women, and explored the role of gut microbiota in improving prediction accuracy. The study involved 105 pregnant women (77 with GDM, 28 healthy), who underwent continuous glucose monitoring (CGM) for 7 days, provided food diaries, and gave stool samples for microbiome analysis. Machine learning models were created using CGM data, meal content, lifestyle factors, biochemical parameters, and microbiota data (16S rRNA gene sequence analysis). Adding microbiome data increased the explained variance in peak glycemic levels (GLUmax) from 34 to 42% and in incremental area under the glycemic curve (iAUC120) from 50 to 52%. The final model showed better correlation with measured PPGRs than one based only on carbohydrate count (r = 0.72 vs. r = 0.51 for iAUC120). Although microbiome features were important, their contribution to model performance was modest.


Conflict of interest statement

Competing interests: The authors declare no competing interests.

Figures

Fig. 1
Fig. 1
Cohort selection.
Fig. 2
Fig. 2. Results of LefSe analysis comparing relative abundance (RA) of microbial features of participants with PPGR (iAUC120) below and above median.
Red indicates higher RA in patients with iAUC120 equal to or above median, and turquoise indicates higher RA in patients with iAUC120 below median, ranked by the effect size.
Fig. 3
Fig. 3. Results of LefSe analysis comparing relative abundance (RA) of microbial features of participants with GLUmax below and above median.
Red indicates higher RA in patients with GLUmax equal to or above median, and turquoise indicates higher RA in patients with GLUmax below median, ranked by the effect size.
Fig. 4
Fig. 4. The results of peak postprandial blood glucose prediction (GLUmax) with the test set.
X scale—CGM-measured values, Y scale—predicted values. a Baseline model—solely carbohydrate content of the meal (carbs); b the model based on clinically available parameters (anthropometric, biochemical, lifestyle questionnaire, meal content, meal context, CGM data); c full model—clinically available parameters + microbial features.
Fig. 5
Fig. 5. The results of iAUC120 prediction with the test set.
X scale—CGM-measured values, Y scale—predicted values. a Baseline model—solely carbohydrate content of the meal (carbs); b the model based on clinically available parameters (anthropometric, biochemical, lifestyle questionnaire, meal content, meal context, CGM data); c full model—clinically available parameters + microbial features.
Fig. 6
Fig. 6. Significance level of the 20 most impactful variables of the models for predicting iAUC120 and GLUmax.
iAUC120 (a) and GLUmax (b) are predicted based on full clinical data with the addition of bacterial features. Higher values of the feature are indicated by colors closer to red, lower values by colors closer to blue. If a point of a certain color is located on the left side of the central axis, the feature has a downward effect on the target variable; if the point is located on the right side, the effect will be the opposite. For example, lower values of GLU0 (the long blue tail on the left of b) correspond to lower values of the target variable (GLUMax). GLUb—glucose level before meal initiation. Numbers near «GLUb» represent the minutes prior to meal initiation in which the measurement was obtained. For example, «GLUb10» represents the glucose level 10 min prior to the meal; Kcal—the energy value of the meal; COC—combined oral contraceptive use any time before pregnancy (1—yes, 0—no); Sausages 1—frequency of consuming sausage products before pregnancy. For a more detailed description of the input features, please refer to Supplementary Table 1.
Fig. 7
Fig. 7. Significance level of the groups of features for the prediction.
SHAP values (linear scale, absolute values) of the groups of features for the prediction of iAUC120, mmol/L∗h (a) and GLUmax, mmol/L (b). The groups of features are presented as follows: «meal composition» includes the nutritional content of the meal, «cgm_data» includes glucose values obtained from CGM devices; «meal_context» includes the nutritional content of meals consumed up to 12 h prior to the index meal; «Microbiome» includes RA of bacteria detected from stool samples; «genetics» includes rs10830963 and rs1387153 variants in MTNR1B gene. The full description of the parameters included in each feature group is listed in Supplementary Table 1.

References

    1. Sacks, D. A. et al. Frequency of gestational diabetes mellitus at collaborating centers based on IADPSG consensus panel-recommended criteria. Diab. Care35, 526–528 (2012). - PMC - PubMed
    1. HAPO Study Cooperative Research Group. Hyperglycemia and adverse pregnancy outcomes. N. Engl. J. Med.358, 1991–2002 (2008). - PubMed
    1. Hajj, N. E., Schneider, E., Lehnen, H. & Haaf, T. Epigenetics and life-long consequences of an adverse nutritional and diabetic intrauterine environment. Reproduction148, R111–R120 (2014). - PMC - PubMed
    1. Popova, P., Castorino, K., Grineva, E. N. & Kerr, D. Gestational diabetes mellitus diagnosis and treatment goals: measurement and measures. Minerva Endocrinol.41, 421–432 (2016). - PubMed
    1. American Diabetes Association Professional Practice Committee. 15. Management of diabetes in pregnancy: standards of care in diabetes—2024. Diab. Care47, S282–S294 (2024). - PMC - PubMed

LinkOut - more resources