. 2025 Feb 7;16(1):1460.
doi: 10.1038/s41467-025-56603-5.

Metabolic deficiencies underlie reduced plasmacytoid dendritic cell IFN-I production following viral infection

Affiliations

Metabolic deficiencies underlie reduced plasmacytoid dendritic cell IFN-I production following viral infection

Trever T Greene et al. Nat Commun. .

Abstract

Type I Interferons (IFN-I) are central to host protection against viral infections, with plasmacytoid dendritic cells (pDC) being the most significant source, yet pDCs lose their IFN-I production capacity following an initial burst of IFN-I, resulting in susceptibility to secondary infections. The underlying mechanisms of these dynamics are not well understood. Here we find that viral infection reduces the capacity of pDCs to engage both oxidative and glycolytic metabolism. Mechanistically, we identify lactate dehydrogenase B (LDHB) as a positive regulator of pDC IFN-I production in mice and humans; meanwhile, LDHB deficiency is associated with suppressed IFN-I production, pDC metabolic capacity, and viral control following infection. In addition, preservation of LDHB expression is sufficient to partially retain the function of otherwise exhausted pDCs, both in vitro and in vivo. Furthermore, restoring LDHB in vivo in pDCs from infected mice increases IFNAR-dependent, infection-associated pathology. Our work thus identifies a mechanism for balancing immunity and pathology during viral infections, while also providing insight into the highly preserved infection-driven pDC inhibition.


Conflict of interest statement

Competing interests: E.I.Z. is in the Scientific Advisory Board of Primmune and AGS Therapeutics. All other authors declare no competing interests.

Figures

Fig. 1
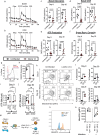
Fig. 1. Defining the Transcriptome changes of pDCs throughout LCMV Infection.
a Experimental design for pDC RNA seq. pDC (Lineage, CD11c+, B220+, BST2+) were isolated from Uninfected or LCMV Cl13 infected mice at day 1 (24 h), 8, or day 30 p.i. and subjected to RNA-seq. b. Principal component (PC) plot showing pDC from uninfected mice, or from mice at day 1 (24 h), 8, or 30 p.i. c Hierarchical clustering of all genes that were DE between pDC from uninfected mice or from mice at day 1 (24 h), 8, or 30 p.i. d Experimental design for analysis of TLR7 dependent gene expression analysis. 50:50 TLR7−/−:WT mixed bone marrow chimeras were generated and infected with LCMV Cl13. At day 8 p.i., WT (Lineage, CD11c+, B220+, BST2+, CD45.1+) or TLR7−/− (Lineage, CD11c+, B220+, BST2+, CD45.2+) were isolated and subjected to Microarray analysis. e Expression of genes differentially regulated in both TLR7−/− vs WT pDC (from d) and in day 8 & 30-infected vs. uninfected mice (from a). Gene expression before and at different times after infection is depicted. Genes associated with cell cycle (GO: 0007049) are indicated by black dots.
Fig. 2
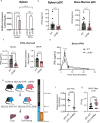
Fig. 2. Clone 13 infection drives long-term changes in metabolism of pDCs and short-term changes in mitochondrial content.
Seahorse assay traces of extracellular acidification rate (ECAR) (a) and oxygen consumption rate (OCR) (b) of pDCs isolated from uninfected (black) or LCMV Cl13 infected (red) mice at day 30 p.i. Derivative measures of ECAR and OCR from Seahorse assay at day 9 and day 30 p.i. (red) compared to uninfected mice (black) c Basal Glycolysis d Basal OCR e ATP production, f Spare Respiratory Capacity g representative stain of MitoSOX in pDC from uninfected mice (black) and LCMV Cl13 infected mice at day 9 (red) or day 30 p.i. (purple) (h) Quantification of MitoSOX gMFI from pDCs. Total per-cell ATP content in pDC and cDC2 from uninfected mice or LCMV Cl13 infected mice at day 9 (i) or day 30 p.i. (j). k Representative staining of mitochondrial mass (MitoGreen) and charge (MitoSox) from pDCs at indicated days p.i. l Quantification of percentage of pDCs with depolarized mitochondria (top) or that are mitochondria deficient (bottom) at indicated days p.i. m Experimental outline for panels n,o. 50:50 TLR7−/−:WT mixed bone marrow chimeras were generated and infected with LCMV Cl13. At day 30 p.i., WT (Lineage, CD11c+, B220+, BST2+, CD45.1+) or TLR7−/− (Lineage, CD11c+, B220+, BST2+, CD45.2+) pDCs were analyzed for MitoSox staining via FACS. n Representative staining of MitoSOX in TLR7−/− and WT pDCs from (m), o Quantification of MitoSOX levels in WT & TLR7−/− pDCs from m. Data are pooled from 3 (a, b), 4 (c, d, e, f), or representative of 2 (g, h, k, o) or 3 (i, j) independent experiments. Data are shown as mean ± SEM. Statistics used are Two tailed Student’s t-test (cf, l), One way ANOVA with Tukey Correction (h), or Two tailed Paired t-test (o).
Fig. 3
Fig. 3. LDHB is essential for optimal mouse pDC IFN-I production in vitro and in vivo.
a Relative expression of LDHB was evaluated by RT-qPCR in purified cDC2, cDC1, and pDC from the spleens of uninfected and LCMV Cl13 infected mice at day 9 p.i. b ELISA quantification of IFNα secreted by pDC isolated from the spleen (left) or bone marrow (right) of WT or LDHB−/− mice after 12 h stimulation with CpG-A. c ELISA (left) or qPCR (right) quantification of secreted IFNα or Ifna transcript in pDC isolated from Flt3L cultures derived from WT or LDHB−/− mice after 12 h stimulation with CpG-A. d ELISA quantification of IFNα in the serum of WT (black) or LDHB−/− (red) mice treated with CpG-A. bd Unstimulated pDC were below the limit of detection. e Experimental design for f-g, 50:50 mixed bone marrow chimeras for BDCA2-DTR:WT or BDCA2-DTR:LDHB were generated, then treated with DT daily from two days prior to infection to deplete BDCA2 expressing pDCs. Mice were then infected with MHV, 48 h.p.i pDCs were sorted and virus titers were quantified. f Expression of Ifna transcript in pDC from e. g Plaque assay quantification of MHV in livers from e. Data are pooled from 2 (d), 3 (c right, g), 4 (c, left), or 5 (b) independent experiments or representative of 2 (a) or 3 (f) independent experiments. Data are shown as mean ± SEM. Statistics used are One way ANOVA with Tukey Correction (a), Two tailed Student’s t-test (b, c, f, g)¸ multiple unpaired two tailed t-tests with two stage step up FDR (d).
Fig. 4
Fig. 4. Human pDCs require LDHB for optimal IFN-I production.
a Experimental outline for the modulation of gene expression in primary human pDCs. Briefly, PBMCs were isolated from donor blood, and pDCs were purified, then transfected with Cas9-RNP containing non-targeting control or targeting LDHB. 24 h later pDCs were stimulated with R848 and cytokine production measured by flow cytometry. b Representative plot of IFNα expression in Cas9-RNP transfected human pDCs after stimulation with R848. c IFNα production in Cas9-RNP transfected human pDCs. d Human PBMC were isolated from healthy donors, treated with the indicated small molecule inhibitors for 2 h prior and concurrent with stimulation, and IFNα was measured in pDCs by flow cytometry 8 h after stimulation with CpG-A. e qPCR quantification of LDHB transcripts in pDCs isolated from healthy controls (HC) or people with HIV (pwHIV). f Representative plot of IFNα staining from unstimulated HC (up), and HC, pwHIV stimulated with HSV-1 (middle and bottom). g comparison of LDHB expression and percentage of IFNα producing pDCs in two pairs (group 1 and 2) of HC and pwHIV processed in parallel. Data are representative of 3 (d left), 4 (c middle, c right, d middle, d right), or 5 (c left) independent experiments with unique donors, pooled averages from 19 patients quantified across 3 independent experiments (e), or 2 groups of age/sex matched HC and pwHIV (g). Data are shown as mean ± SEM. Statistics used are Two tailed Paired t-tests (c), Two tailed Mann-Whitney Test (e) or One-Way ANOVA with Dunnett correction (d).
Fig. 5
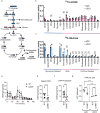
Fig. 5. Both glucose and lactate feed the TCA cycle in DCs but pDCs are less labeled from glucose.
a Diagram of stable-isotope tracing incorporation of 13C-Lactate and 13C-Glucose into glycolytic and TCA intermediates in pDCs isolated from Flt3L culture by FACS at day 8 p.c. Fractional labeling of glycolysis and TCA cycle intermediates in pDCs and cDC2 by 13C-Lactate (b) and 13C-Glucose (c) glycolysis and TCA cycle related metabolites are indicated below the graphs. d Seahorse tracing of WT (black) or LDHB−/− (pink) pDCs. Derivative measures from Seahorse assay of WT (black) or LDHB−/− (pink) pDCs (e) Basal OCR (f) ATP production. g Total ATP levels in WT (black) or LDHB−/− (pink) pDCs or cDC2. Data are pooled from 2 (b, c), 3 (d), or 4 (e, f) independent experiments or representative of 3 independent experiments (g). Data are shown as mean ± SEM. Statistics used are Two tailed Student’s t-tests (b, c, e, f) or Two-Way ANOVA with Tukey Correction (g).
Fig. 6
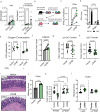
Fig. 6. Enforced LDHB expression in suppressed pDCs restores function, and associates with potentiated infection-induced pathology.
a Bone marrow from LCMV Cl13 infected mice at day 30 p.i. was isolated and subjected to Flt3L culture. Cultures from individual mice were separated and half-each transduced with retrovirus encoding LDHB or vector control. At day 8 p.c., pDCs were isolated by FACS and stimulated for 12 h with CpG and Ifna transcript was analyzed by qPCR. b Outline of proDC transfer experimental design to analyze pDC functional restoration in vivo. Bone marrow from uninfected mice was subjected to Flt3L culture and transduced with retrovirus encoding LDHB or vector control. At day 3.5 p.c. pro-DC were isolated by FACS and transferred into LCMV Cl13 infected mice at day 7.5 p.i. 6 days later splenocytes were isolated from recipients, and subjected to stimulation for 8 h with CpG-A, then interferon production in pDCs was assessed by flow cytometry. c IFNα production in pDCs derived from pro-DCs with enforced expression of vector control or LDHB was measured by flow cytometry. d pDCs isolated from the spleens of non-infected mice were treated with 1 µM Oligomycin for 2 h then stimulated with CpG for 6 h and IFN-I was measured by bioassay. Flt3L-culture-derived pDCs from day-30 LCMV Cl13 infected mice, expressing vector control or LDHB, were analyzed for OCR via Seahorse Xfe96 prior to or 30 min after stimulation with CpG (e) or mitochondrial derived superoxide (f). g Colon length was measured in LCMV Cl13 infected mice transferred with pro-DCs with enforced expression of vector control or LDHB, as depicted in b, at day 14 p.i. (day 6 post transfer). h Colon length was measured in LCMV Cl13 infected mice transferred with differentiated Flt3L-derived pDCs, with enforced expression of vector control or LDHB, at day 11 p.i. (day 2.5 post transfer). Representative (i) and quantitative (j) analysis of colon histology from LCMV Cl13 infected mice receiving differentiated pDCs as described in (h). Colon length (k) and histology score (l) were depicted as described in g for mice receiving differentiated pDCs and concurrently treated with either Isotype control antibody or IFNAR blocking antibody. Measurements were made blinded (g, h, j, k, l). Data are representative of 2 (i, j) experiments or pooled from 2 (a, d, e, k, l), 4 (c, f, g), or 5 (h) independent experiments. Data are shown as mean ± SEM. Statistics used were Two tailed Paired t-test (a, c, f) One-way ANOVA with Tukey Correction (d), Two tailed Student’s t-test (e, g, j), or two-way ANOVA with Fisher’s LSD (k, l) p < 0.05 *, p < 0.01; **, p < 0.001 ***, p < 0.0001 ****.

Update of

Similar articles

Cited by

References

    1. Zuniga, E. I., Macal, M., Lewis, G. M. & Harker, J. A. Innate and adaptive immune regulation during chronic viral infections. Annu. Rev. Virol.2, 573–597 (2015). - PMC - PubMed
    1. Virgin, H. W., Wherry, E. J. & Ahmed, R. Redefining chronic viral infection. Cell138, 30–50 (2009). - PubMed
    1. Stelekati, E. & Wherry, E. J. Chronic bystander infections and immunity to unrelated antigens. Cell Host Microbe12, 458–469 (2012). - PMC - PubMed
    1. Attanasio, J. & Wherry, E. J. Costimulatory and coinhibitory receptor pathways in infectious disease. Immunity44, 1052–1068 (2016). - PMC - PubMed
    1. Buchbinder, E. I. & Hodi, F. S. Immune-checkpoint blockade—durable cancer control. Nat. Rev. Clin. Oncol.13, 77–78 (2016). - PubMed

Substances

LinkOut - more resources