. 2025 Feb 7;16(1):1318.
doi: 10.1038/s41467-025-56567-6.

Retrotrans-genomics identifies aberrant THE1B endogenous retrovirus fusion transcripts in the pathogenesis of sarcoidosis

Affiliations

Retrotrans-genomics identifies aberrant THE1B endogenous retrovirus fusion transcripts in the pathogenesis of sarcoidosis

Shunsuke Funaguma et al. Nat Commun. .

Abstract

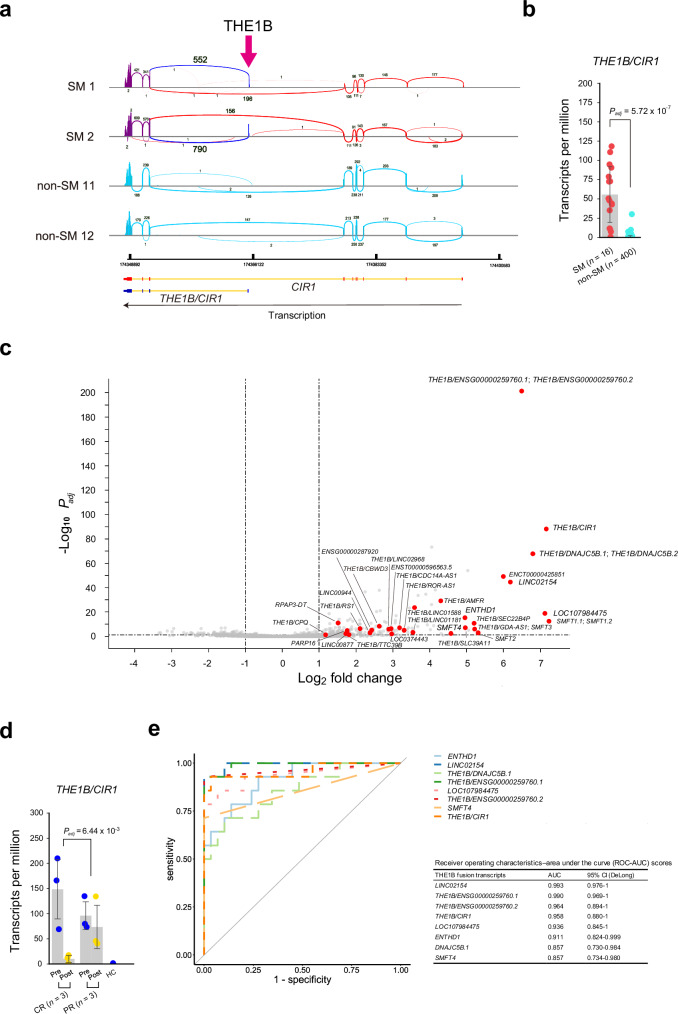
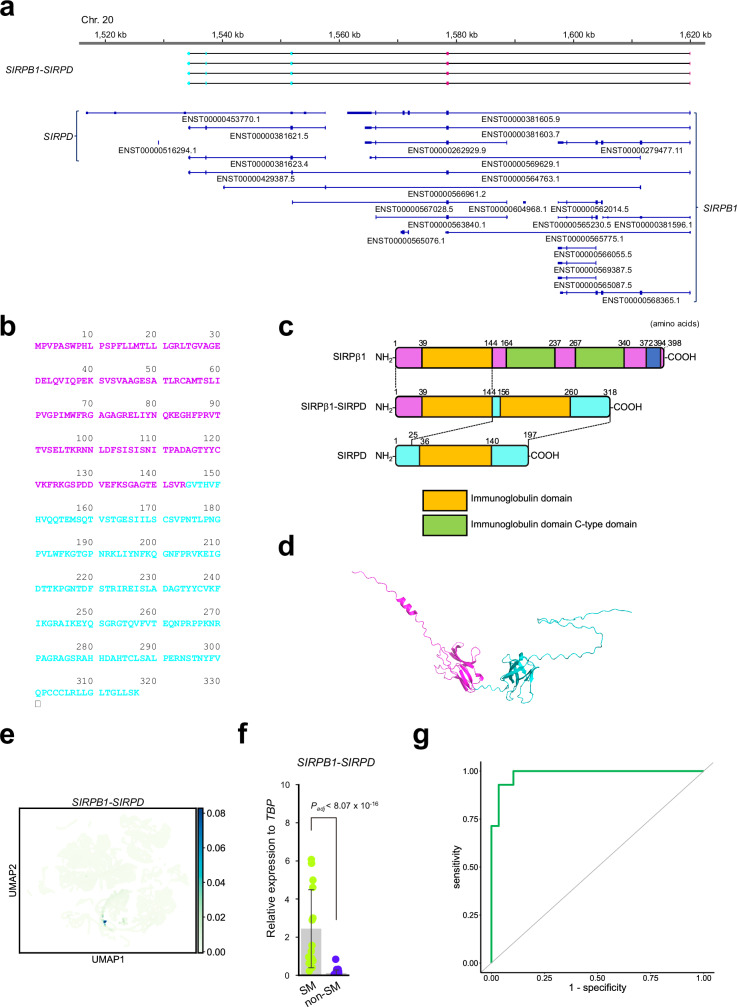
Transposon-like human element 1B (THE1B) originates from ancient retroviral sequences integrated into the primate genome approximately 50 million years ago, now accounting for at least 27,233 copies in the human genome, suggesting their extensive influence on human genomic architecture. Here we report identification of 19 THE1B fusion transcripts through short- and long-read RNA-seq analysis, 15 of which are previously unmapped, showing elevated expression in 16 individuals with sarcoid myopathy (SM), as compared to 400 controls with various other muscle diseases. Analysis of publicly available RNA-seq data indicated a correlation between the reduced expression of eight THE1B fusion transcripts and clinical improvement in individuals with cutaneous sarcoidosis receiving tofacitinib treatment. Single-cell or single-nucleus RNA-seq analyses of sarcoidosis not only confirmed these transcripts but also revealed a novel read-through transcript, SIRPB1-SIRPD, and TREM2.1, predominantly in granuloma-associated macrophages. The expression profiles of THE1B fusion transcripts in tuberculosis (TB) significantly differed from SM in single-cell RNA-seq data, suggesting that the differences between TB's caseous granulomas and sarcoidosis's non-caseous granulomas might be linked to disparate expression patterns of THE1B fusion transcripts. Our retrotrans-genomics approach has not only identified the genomic landscape of sarcoidosis but also provided new insights into its etiology.


Conflict of interest statement

Competing interests: All authors declare no direct financial interests related to this work. A patent application titled “Biomarker for the diagnosis of granuloma-forming diseases,” A.I., S.F., I.N., and Y.S. as inventors has been published on October 31, 2024, as WO/2024/225403. A.I. is an associate editor of the Journal of Human Genetics and is a member of the editorial board of Human Genome Variation. J.T. is a member of the editorial board of Neuromuscular Disorders. I.N. holds various leadership positions that may be perceived as non-financial competing interests, including serving as President of the Asian Oceanian Myology Center and holding executive board roles with the World Muscle Society, Japanese Society of Neurology, Japanese Society of Child Neurology, Japanese Society of Neurological Therapeutics, Japanese Society of Neuropathology, and the Japan Muscle Society. In addition, I.N. is involved in the education committees of the Asian and Oceanian Association of Neurology and the World Federation of Neurology and has editorial roles in Neuromuscular Disorders, Neuropathology, and Journal of Neuromuscular Diseases. The authors declare no other competing interests.

Figures

Fig. 1
Fig. 1. Overview of retrotrans-genomics and validation studies.
Retrotrans-genomics has a double meaning: genome-wide retrotransposon analysis and reverse genomics from retro-transcriptome to whole genome analysis. a Schematic diagram of genomic structures of CIR1 locus. Orange rectangles are shown to the exon of the gene. The green arrow shows the direction of the transcription. b Schematic diagram of full-length cDNA of a THE1B fusion transcript by Nanopore long-read seq. c Expression analysis of THE1B/CIR1 by Salmon quantification. Error bar means the standard deviation value. The adjusted P values (Padj) were calculated by a two-sided Wald test and Benjamin-Hochberg correction. Source data are provided as a Source Data file. d Retrotrans-genomics of THE1B fusion transcripts in sarcoid myopathy by COFFEE. Red blots show highly expressed THE1B elements in sarcoid myopathy by using PhenoGram. e Schematic diagram of THE1B/DNAJC5B.1, THE1B/DNAJC5B.2 and canonical DNAJC5B. THE1B element is located 42 kb upstream from exon 1 of DNAJC5B. Brown rectangles are shown to be exons of the genes. f, g Validation studies by (f) RNA-seq data on a public database, (g) RT-qPCR. h Single-cell and single-nucleus cell RNA-seq shows the cells expressing THE1B fusion transcripts.
Fig. 2
Fig. 2. Discovery of THE1B fusion transcripts associated with SM.
a Sashimi plot for THE1B/CIR1 that are alternatively spliced from THE1B element (is indicated in blue line) within intron 7 of CIR1 (in red) in SM, but not in non-SM (in light blue). Common exons of THE1B/CIR1 and CIR1 are indicated in purple. Genomic structures of THE1B/CIR and CIR1 are also shown below the Sashimi plots. b Each dot denotes the expression level (transcripts per million) of THE1B/CIR in individuals. Red dots denote the expression level in SM individuals (n = 16), and blue dots denote the expression level in non-SM (n = 400). The adjusted P values (Padj) were calculated by a two-sided Wald test and Benjamin-Hochberg correction. The gray bar indicates the mean value. Error bar means the standard deviation value. Source data are provided as a Source Data file. c Volcano plot showing each highly expressed THE1B (red) fused with neighbor exons of human genes (Padj < 0.05, log2FC > 2). The adjusted P values (Padj) were calculated by a two-sided LRT test and Benjamin-Hochberg correction. Source data are provided as a Source Data file. d Each dot denotes the expression level (transcripts per million) of THE1B/CIR in individuals. Blue dots denote the expression level before the tofacitinib treatment, and yellow dots denote the expression level after the tofacitinib treatment. “Pre” and “Post” are indicated measurements before and during treatment, respectively. “CR,” “PR,” and “HC” are indicated as complete responders to tofacitinib treatment (n = 3), partial responders to tofacitinib treatment (n = 3), and healthy controls (n = 2), respectively. The gray bar indicates the mean value. Error bar means the standard deviation value. The adjusted P-values (Padj) were calculated by two-sided LRT and Benjamin-Hochberg correction. Source data are provided as a Source Data file. e Measurement of discrimination ability of each THE1B fusion transcript by ROC-AUC curve.
Fig. 3
Fig. 3. Identification of THE1B fusion transcripts expressing cells.
a Cell annotation. UMAP projection of integrated snRNA-seq data from two individuals with SM. b Relative expression of CHIT1, a marker for GA macrophage in sarcoidosis. c Dot plot showing the expression level per cell in individuals with SM. d Relative expression of ZNF430. e MUSCLE alignment of putative ZNF binding sites in 8 THE1B elements. f and g Dot plots showing the expression level per cell in individuals with cutaneous sarcoidosis and tuberculosis, respectively.
Fig. 4
Fig. 4. Expression of TREM2 in individuals with SM.
a Heatmap showing Pearson’s correlation coefficients between Pattern Recognition Receptors (PRRs) and 8 THE1B fusion transcripts. b Relative expression of TREM2 in individuals with SM. c 2D scatter plot shows relationship between TREM2 and THE1B/CIR1. df Each dot denotes the expression level (transcripts per million) of (d) TREM2.1, (e) TREM2.2, and (f) TREM2.3 in individuals, respectively. Red dots denote the expression level in SM individuals and blue dots denote the expression level in non-SM. The adjusted P-values (Padj) were calculated by two-sided LRT and Benjamin-Hochberg correction. Source data are provided as a Source Data file. g Each dot denotes expression level (transcripts per million) of TREM2.1 in the same way as in Fig. 2d. h RT-qPCR assay. Each dot denotes the relative expression level of TREM2.1 to TBP mRNA of individuals. Error bar means the standard deviation value. We compared the relative expression of target genes between SM (n = 14) and non-SM (n = 29), followed by two-sided permuted Brunner-Munzel test and Benjamini-Hochberg correction. The experiment was performed at least two times, and the similar results were confirmed. Source data are provided as a Source Data file. i Graphical visualization of Gene Ontology Enrichment analysis using ShinyGO 0.80. jm UMAP projection of snRNA-seq data from individuals with SM. Relative expression of (j) NFKB1, (k) RELA, (l) NFKB2 and (m) RELB.
Fig. 5
Fig. 5. Gene structure and expression of SIRPB1-SIRPD.
a Long-read RNA-seq of SIRPB1-SIRPD (above). Genomic structure of SIRPB1 and SIRPD (below). b Amino acid sequence of SIRPB1-SIRPD. Magenta literature denotes the part identical to SIRPB1 amino acid sequence (O00241-1, amino acids 1-144) and cyan literature denotes the part identical to SIRPD amino acid sequence (Q5TFQ5, amino acids 25-198). c Predicted domains of SIRPB1, SIRPB1-SIRPD and SIRPD using SMART (https://smart.embl.de/). The C-terminal region colored with dark blue in SIRPB1 indicates the transmembrane domain. d Alphafold2 prediction of 3D structure of SIRPB1-SIRPD. e UMAP projection of scRNA-seq data from individuals with cutaneous sarcoidosis. Relative expression of SIRPB1-SIRPD. f RT-qPCR assay. We compared the relative expression of target genes between SM (n = 14) and non-SM (n = 29), followed by two-sided permuted Brunner-Munzel test and Benjamini-Hochberg correction. The experiment was performed at least two times, and the similar results were confirmed. Each dot denotes the relative expression level of SIRPB1-SIRPD to TBP mRNA of individuals. Error bar means the standard deviation value. Source data are provided as a Source Data file. g Measurement of discrimination ability of SIRPB1-SIRPD by ROC-AUC curve.

References

    1. Goke, J. & Ng, H. H. CTRL+INSERT: retrotransposons and their contribution to regulation and innovation of the transcriptome. EMBO Rep.17, 1131–1144 (2016). - PMC - PubMed
    1. Perron, H. et al. Leptomeningeal cell line from multiple sclerosis with reverse transcriptase activity and viral particles. Res. Virol.140, 551–561 (1989). - PubMed
    1. Perron, H. et al. Molecular characteristics of Human Endogenous Retrovirus type-W in schizophrenia and bipolar disorder. Transl. Psychiatry2, e201 (2012). - PMC - PubMed
    1. Li, W. et al. Human endogenous retrovirus-K contributes to motor neuron disease. Sci. Transl. Med.7, 307ra153 (2015). - PMC - PubMed
    1. Faucard, R. et al. Human endogenous retrovirus and neuroinflammation in chronic inflammatory demyelinating polyradiculoneuropathy. EBioMedicine6, 190–198 (2016). - PMC - PubMed

Substances

LinkOut - more resources