. 2025 Feb 7;16(1):1448.
doi: 10.1038/s41467-025-56713-0.

Orphan G protein-coupled receptor GPRC5B controls macrophage function by facilitating prostaglandin E receptor 2 signaling

Affiliations

Orphan G protein-coupled receptor GPRC5B controls macrophage function by facilitating prostaglandin E receptor 2 signaling

Jeonghyeon Kwon et al. Nat Commun. .

Abstract

Macrophages express numerous G protein-coupled receptors (GPCRs) that regulate adhesion, migration, and activation, but the function of orphan receptor GPRC5B in macrophages is unknown. Both resident peritoneal and bone marrow-derived macrophages from myeloid-specific GPRC5B-deficient mice show increased migration and phagocytosis, resulting in improved bacterial clearance in a peritonitis model. In other models such as myocardial infarction, increased myeloid cell recruitment has adverse effects. Mechanistically, we found that GPRC5B physically interacts with GPCRs of the prostanoid receptor family, resulting in enhanced signaling through the prostaglandin E receptor 2 (EP2). In GPRC5B-deficient macrophages, EP2-mediated anti-inflammatory effects are diminished, resulting in hyperactivity. Using in silico modelling and docking, we identify residues potentially mediating GPRC5B/EP2 dimerization and show that their mutation results in loss of GPRC5B-mediated facilitation of EP2 signaling. Finally, we demonstrate that decoy peptides mimicking the interacting sequence are able to reduce GPRC5B-mediated facilitation of EP2-induced cAMP signaling in macrophages.


Conflict of interest statement

Competing interests: The authors declare no competing interests.

Figures
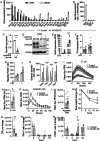
Fig. 1
Fig. 1. Generation of myeloid-specific GPRC5B-KOs and role of GPRC5B in RPM.
A Library size-normalized counts detected by RNA sequencing in mouse RPM and in M0-differentiated BMDM (3 mice each; only GPCRs with average count >15 displayed). B Gprc5b expression in RPM and lymph node-derived lymphocytes was determined by NanoString RNA analysis (cells pooled from two mice per data point). C Knockout efficiency in RPM from control mice (white) and M-G5b-KOs (gray) was analyzed by qRT-PCR (C, n = 4, data normalized to Gapdh and controls set to 1). D Knockout efficiency in RPM was analyzed by immunoblotting (unspecific band around 38 kDa; the higher of the two specific bands probably represents glycosylated GPRC5B; GAPDH as loading control). E, F Expression of Nos2 (E) and Tnf (F) was determined in RPM by qRT-PCR under basal conditions and after 6 h of stimulation with 1 µg/ml LPS (n = 11/12/12/12 in E, 12/10/11/12 in F), data normalized to Gapdh and control set to 1). G Basal and C5a (20 ng/ml)-induced transwell migration in RPM (all cells pretreated with LPS 1 µg/ml for 3 h to facilitate migration) (n = 3). H The distance travelled by individual RPM in response to different chemotactic factors (C5a, 20 nM; CCL5, 10 ng/ml; fMLP, 10 nM) was determined by live cell imaging (n = 512 cells from 2 mice per group; cells pretreated with LPS 1 µg/ml for 3 h to facilitate migration, arb. units: arbitrary units). Phagocytic activity of LPS (1 µg/ml, 6 h)-stimulated RPM was determined by uptake of pHrodo E. coli bioparticles (I, J, n = 5) or pHrodo-labeled apoptotic thymocytes (K, L n = 10); I + K show original traces, J + L statistical evaluation of areas under the curve (AUC). Body weight change (M) and bacterial colony-forming units in peritoneal lavage fluid harvested 24 h after injection of fecal bacteria (N) (n = 10). O, P Numbers of CD11b+, F4/80+, MHCII-, Tim4+ RPM and CD11b+, F4/80lo, MHCII+, CCR2+ BMDM before and 3, 24, and 54 h after i.p. injection of fecal bacteria (n = 3/3/3/3/11/12/5/5). Data are means ± SEM; comparisons between genotypes were performed using unpaired two-sided Student’s t-test (C, J, L, N), two-way ANOVA (E-H) or two-way RM-ANOVA (M) with Sidak’s multiple comparison test, unpaired two-sided t-test corrected for multiple testing by two-stage step-up method Benjamini, Krieger and Yekutieli (O, P). *P < 0.05; ***P < 0.001; ****P < 0.0001; n, number of individual mice. Source data are provided as a Source Data file.
Fig. 2
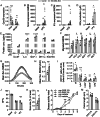
Fig. 2. Enhanced activity of GPRC5B-deficient BMDM.
A Knockout efficiency was determined by qRT-PCR in RPM and M0 BMDM (data normalized to Gapdh and RPM controls set to 1) (n = 12). Analyses in resting and LPS (1 μg/ml, 6 h)-stimulated M0 BMDM: Expression of inflammatory genes (B, C; n = 15/14/15/15 in B, 15/14/15/15 in C), production of NOx (D; n = 3) or release of cytokines (E, n = 3). F Transwell migration of M1 BMDM in response to different chemotactic factors (n = 6) (CCL5: 75 ng/ml, CCL2: 10 ng/ml, SDF-1β: 100 ng/ml, C5a: 20 ng/ml, fMLP: 10 nM). Uptake of pHrodo E.coli fragments by M0 BMDM: G, exemplary curves; H, statistical analysis of AUC (n = 6). I Flow cytometric analysis of CD11b-positive cells in the combined infarct and border zones of hearts harvested 4 days after infarction (n = 5). J Echocardiographic analysis of ejection fraction (EF%) before and after infarction (8 controls, 4 KOs). K Histological analysis of scar size in hearts harvested 21 days after infarction (n = 7 controls, 4 KOs), left ventricle (LV). L, M DSS colitis: Disease activity index integrating body weight change, stool consistency, intestinal bleeding (L) and colon length on day 6 (M) (n = 7(L), 7/7/10/11 in M). Data are means ± SEM; comparisons between genotypes were performed using unpaired two-sided Student’s t-test (A, H, K), two-way ANOVA with Sidak’s multiple comparisons test (B-F, J, M), unpaired two-sided t-test corrected for multiple testing by two-stage step-up method Benjamini, Krieger and Yekutieli (I), two-way repeated measures ANOVA with Sidak’s multiple comparisons test (L). n, number of mice per group; *P < 0.05; **P < 0.01; ***P < 0.001; ****P < 0.0001. Source data are provided as a Source Data file.
Fig. 3
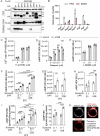
Fig. 3. Interaction of GPRC5B with other prostanoid receptors.
A Western blot detection of HA and FLAG signals in lysates of HEK cells expressing FLAG-tagged GPRC5B in combination with different HA-tagged prostanoid receptors before (“input”) and after immunoprecipitation of GPRC5B-FLAG/Myc (“Pulldown FLAG”). B Expression of prostanoid receptors was determined by RNA sequencing (n = 12) (same samples as in Fig. 1A). C Calcium mobilization induced by EP1 agonist 17-pt-PGE2 in HEK cells transfected with calcium sensor aequorin, EP1 receptor, and control siRNA (siContr) or siRNA directed against GPRC5B (siG5B), respectively (n = 8). RLU: relative light unit. cAMP production induced by EP2 agonist butaprost (D) or EP4 agonist L-902688 (E) was determined in HEK cells transfected with a cAMP GloSensor plasmid, EP2 (D) or EP4 (E) receptors, as well as control siRNA or siRNA directed against GPRC5B, respectively (n = 8). F, G cAMP production induced by EP2 agonist butaprost (F) or EP4 agonist L-902688 (G) in HEK cells transfected with a cAMP GloSensor plasmid, EP2 (F) or EP4 (G) receptors, as well as empty vector (EV) or GPRC5B (G5B) as indicated (n = 8 and 4, respectively). H Butaprost-induced cAMP production in HEK cells transfected with cAMP GloSensor plasmid and empty vector (EV) or GPRC5B as indicated (without EP2 transfection; n = 4). I, J Butaprost-induced cAMP production in HEK cells transfected with empty vector (EV) or GPRC5B in the presence (I) or absence (J) of overexpressed EP2 receptor was determined by ELISA (n = 6/8/7/7/6/8/6/7 in I, 6(J)). K Spatial correlation between HA and FLAG signals in HEK cells co-transfected with HA-EP2 and GPRC5B-FLAG/Myc: exemplary photomicrographs and statistical analysis (Pearson’s coefficient, n = 29 cells). Data are means ± SEM; comparisons between genotypes (C-E) or both genotypes and treatments (G-J) were done using two-way ANOVA and Sidak’s post hoc test (C-E, G-J) or one-way ANOVA with Tukey’s multiple comparison test (F). EV, empty vector; G5B, GPRC5B-encoding plasmid; n, number of independent experiments; siContr, scrambled control siRNA; siG5b, siRNA directed against GPRC5B; *P < 0.05; **P < 0.01; ***P < 0.001; ****P < 0.0001. Source data are provided as a Source Data file.
Fig. 4
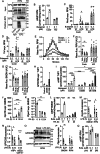
Fig. 4. Altered EP2 signaling in macrophages.
A Western blot detection of EP2 and GPRC5B (G5B) signals in lysates of RPM before (“input”) and after immunoprecipitation of EP2 using anti-EP2 antibodies (“Pulldown EP2”) (IgG and GPRC5B-KO as negative control). B Butaprost-induced cAMP production was determined in RPM by ELISA (n = 5). C, D The effect of butaprost on expression of Nos2 (C) and Tnf (D) was determined by qRT-PCR in basal and LPS (1 µg/ml, 6 h)-stimulated RPM (n = 15/11/15/11/15/12/15/12 in C, 9/8/9/8/9/9/9/9 in D); data normalized to Gapdh and basal controls set to 1). E–G Effect of EP2 agonists on the uptake of pHrodo E. coli bioparticles in RPM (E, F) or M0 BMDM (G): E, exemplary curves (n = 3); F + G, statistical evaluation (n = 9(F), 8(G)). H, I Effect of GPRC5B knockdown (siG5B) or overexpression (OE G5B) on butaprost-induced cAMP production in human THP1 cells: efficiency of knockdown/overexpression (H, n = 3) and analysis of cAMP levels by ELISA (I, n = 5). All three groups were transfected both with plasmid and siRNAs (Control: EV+siControl; siG5B: EV + GPRC5B siRNA; OE G5B: GPRC5B plasmid + control siRNA). J, K Expression of Gprc5b (J) and Ptger2 (K) was determined by qRT-PCR in M0 BMDM exposed for the indicated times to 1 µM retinoic acid (RA) (n = 8/5/8/6 in J, 8/2/6/6 in K). L Butaprost-induced cAMP production in BMDM that had been exposed to RA for the indicated times (n = 6). M, N Expression of Gprc5b/GPRC5B in mouse macrophages (M) or human THP1 and CD11b-positive blood cells (N) was determined by qRT-PCR after 24 h exposure to vehicle or 1 µg/ml LPS (n = 8(BMDM)/12(RPM) in M, 12(THP1)/8(CD11b-positive blood cell) in N; data normalized to Gapdh/GAPDH and basal set to 1). O Western blot detection of EP2 and GPRC5B in lysates of vehicle- or LPS-treated RPM (GAPDH as loading control). P Expression of Ptger2 in vehicle- and LPS-treated mouse macrophages (n = 8(BMDM)/12(RPM)). Q Butaprost-induced cAMP production in RPM exposed to vehicle or LPS for 24 h (n = 6). Data are means ± SEM; comparisons between agonist- and respective vehicle-treated groups (B-D, F, G, J, K, L-Q) or all groups (I) was done using one-way ANOVA with Sidak’s multiple comparisons test (B), two-sided Mann-Whitney test with Holm-Sidak’s multiple comparisons test (C, D), one-way ANOVA with Dunnett’s multiple comparison test (F, G), Kruskal-Wallis test with Dunn’s multiple comparison test (H, J, K), two-way ANOVA with Tukey’s (I) or Sidak’s (L, Q) post hoc test, unpaired two-sided t tests (M, N, P), two-sided Mann-Whitney test (O). EV, empty vector; n, number of independent experiments or mice per group; veh., vehicle (DMSO for butaprost and PGE2; H2O for LPS); *P < 0.05; **P < 0.01; ***P < 0.001; ****P < 0.0001. Source data are provided as a Source Data file.
Fig. 5
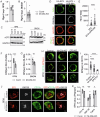
Fig. 5. Effect of GPRC5B on EP2 expression and membrane availability.
A, B Ptger2 expression in RPM (A, n = 12)) and M0 BMDM (B, n = 15) was determined by qRT-PCR (normalization to Gapdh, control set to 1). C EP2 expression was determined by Western blotting in RPM and M0 BMDM lysates from control mice (Contr) and M-G5b-KOs (KO). GAPDH as loading control. D, E HEK cells co-transfected with HA-EP2 alone or HA-EP2 + GPRC5B-FLAG/Myc (G5B-Myc) were first subjected to plasma membrane staining with WGA, then fixed, permeabilized and stained with anti-Myc and anti-HA antibodies: exemplary photomicrographs (D) and statistical evaluation of the HA-EP2 signal within WGA (E) (n = 26 and 36 cells). F, G ELISA-based detection of EP2(ec) in the plasma membrane of RPM (F) and M0 BMDM (G) (n = 14(F), 16(G) samples from 3-4 mice per group). H, I Antibody-mediated detection of EP2(ec) in non-permeabilized RPM from control mice and M-G5b-KOs (CD11b staining indicates plasma membrane, global EP2-KOs shown as specificity control): exemplary photomicrographs (H) and statistical evaluation of EP2(ec) signal in CD11b area (I) (n = 44/37/7 cells from 3 mice per group). J, K RPM from control and KO mice were fixed, permeabilized and stained for EP2(ec) and Golgi marker GM130, and then stained with anti-CD11b antibodies (for plasma membrane): exemplary photomicrographs (J) and statistical evaluation (K) of the colocalization of EP2(ec) with CD11b, GM130 or calreticulin (examples for the latter in Supplementary Fig. 9C) (n = 14 cells from 2 mice each). Data are means ± SEM; differences between groups were analyzed using two-sided Mann-Whitney test (A, B, E), unpaired two-sided t-test (F, G), Kruskal-Wallis test with Dunn’s correction for multiple testing (I), unpaired two-sided t test with Holm-Sidak correction for multiple testing (K). n, number of analyzed mice (A, B, F, G) or cells (E, I, K); *P < 0.05; **P < 0.01; ***P < 0.001; ****P < 0.0001. Source data are provided as a Source Data file.
Fig. 6
Fig. 6. Interfering with the GPRC5B/EP2 interaction: in silico docking and mutation of GPRC5B.
A The refined predicted orientation of the GPRC5B-EP2 complex (GPRC5B in green, EP2 in cyan). B Three sets of residues within GPRC5B considered for site-directed mutagenesis. C Exemplary photomicrographs showing cellular distribution of FLAG/Myc-tagged wild type GRC5B (G5B-wt, top) and GPRC5B carrying 7 alanine mutations (G5B-mut7, bottom) in permeabilized HEK cells (WGA as membrane staining). D Western blot detection of HA and FLAG signals in lysates of HEK cells expressing HA-tagged EP2 in combination with empty vector (EV), FLAG-tagged human G5B-wt or G5B-mut7: “input” shows lysates before, “pulldown HA” after immunoprecipitation with anti-HA beads. E, Butaprost-induced cAMP production in HEK cells transfected with cAMP GloSensor plasmid, HA-EP2, and wild type or mutant GPRC5B as indicated (n = 4). F Western blot detection of HA and FLAG signals in lysates of HEK cells expressing HA-tagged EP2 in combination with empty vector (EV) or FLAG-tagged human wild type or mutant GPRC5B as indicated. G, Butaprost-induced cAMP production in HEK cells transfected with cAMP GloSensor plasmid, HA-EP2, and wild type or mutant GPRC5B as indicated (n = 10). H, I HEK cells were transfected with HA-EP2 and wild type or mutant GPRC5B as indicated and subjected to plasma membrane staining with WGA, followed by permeabilization and staining with anti-HA antibodies: exemplary photomicrographs (H) and statistical evaluation of the HA-EP2 signal within WGA (I) (n = 36/26/31/37/35/30 cells). Data are means ± SEM; comparisons with empty vector-transfected samples (E) or G5B-wt-transfected samples (G, I) were performed using Kruskal-Wallis test with Dunn’s correction for multiple testing. EV, empty vector; n, number of independent experiments; *P < 0.05; **P < 0.01; ***P < 0.001; ****P < 0.0001. Source data are provided as a Source Data file.
Fig. 7
Fig. 7. Blocking GPRC5B-mediated facilitation of EP2 signaling using a decoy peptide.
A Effect of target and control peptides (0.1 or 1 µM each) on butaprost-induced cAMP production in HEK cells transfected with cAMP GloSensor plasmid, HA-EP2, empty vector (EV) or GPRC5B-FLAG/Myc as indicated (n = 6). B, C Effect of target and control peptides (10 µM) on co-immunoprecipitation of GPRC5B-FLAG/Myc with HA-EP2 in HEK cells: exemplary blots (B) and densitometric analysis of signal strength for co-precipitated GPRC5B-FLAG (FLAG(coIP)) relative to immunoprecipitated HA-EP2 (HA(IP)) (n = 3). D, E Peptide effect (0.1 or 1 µM each) on butaprost-induced cAMP production was determined in M0 BMDM (D) and RPM (E) (n = 6). F–H, Peptide effect (1 µM each) on phagocytosis of pHrodo E. coli bioparticles in M0 BMDM: Exemplary traces from control (F) and KO (G) mice; H: statistical evaluation of AUC (n = 9). Note that basal difference between control and KO is less pronounced in the presence of vehicle. Preincubation with peptides was 1 h in all cases. Data are means ± SEM; differences between peptide-treated and untreated groups were analyzed using Kruskal-Wallis test with Dunn’s multiple comparisons test (A, D, E, H) or one-way ANOVA with Dunnett’s correction for multiple testing (C). n, number of independent experiments); *P < 0.05; **P < 0.01; ***P < 0.001. Source data are provided as a Source Data file.

References

    1. Varol, C., Mildner, A. & Jung, S. Macrophages: development and tissue specialization. Annu Rev. Immunol.33, 643–675 (2015). - PubMed
    1. Park, M. D., Silvin, A., Ginhoux, F. & Merad, M. Macrophages in health and disease. Cell185, 4259–4279 (2022). - PMC - PubMed
    1. Locati, M., Curtale, G. & Mantovani, A. Diversity, Mechanisms, and Significance of Macrophage Plasticity. Annu Rev. Pathol.15, 123–147 (2020). - PMC - PubMed
    1. Lazarov, T., Juarez-Carreno, S., Cox, N. & Geissmann, F. Physiology and diseases of tissue-resident macrophages. Nature618, 698–707 (2023). - PMC - PubMed
    1. Davies, L. C. & Taylor, P. R. Tissue-resident macrophages: then and now. Immunology144, 541–548 (2015). - PMC - PubMed

MeSH terms

Substances

LinkOut - more resources