. 2025 Feb 7;15(1):4614.
doi: 10.1038/s41598-025-86892-1.

Movement traits important to conservation and fisheries management: an example with red snapper

Affiliations

Movement traits important to conservation and fisheries management: an example with red snapper

Susan K Lowerre-Barbieri et al. Sci Rep. .

Abstract

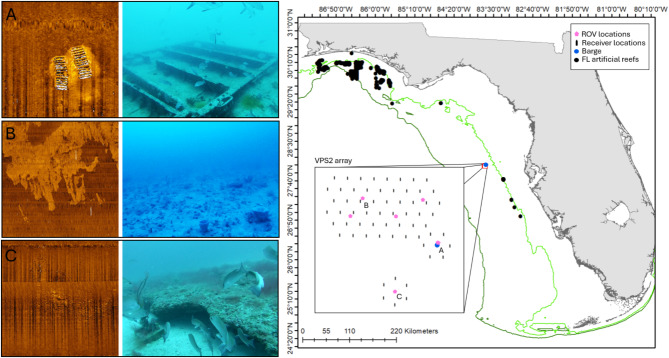
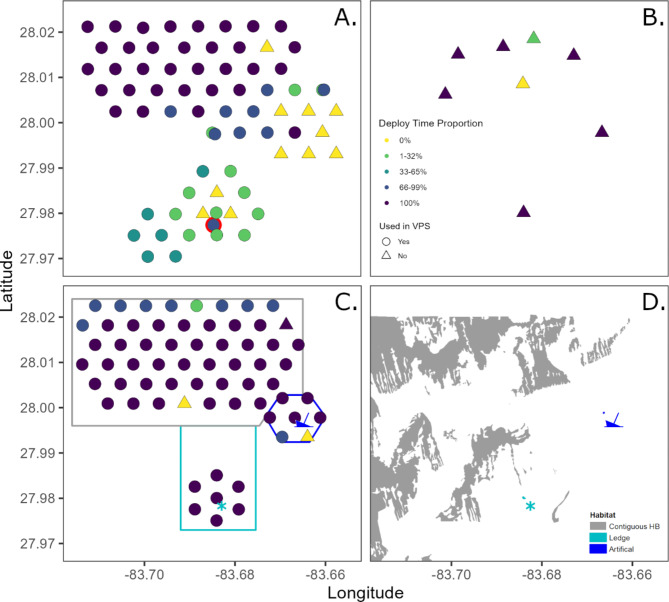
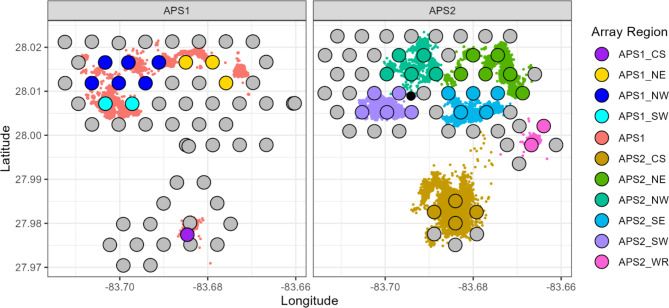
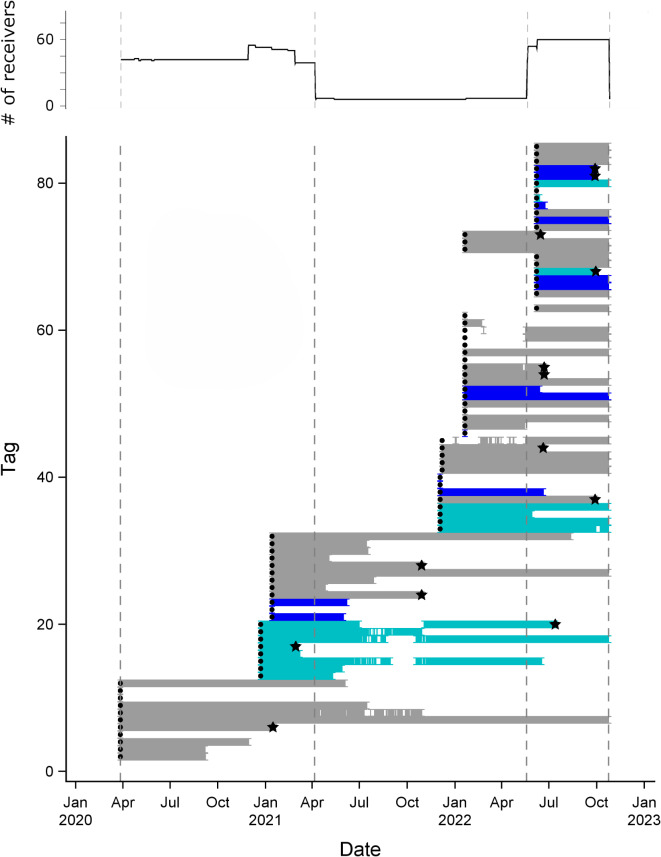
Site fidelity, space use, and dispersal are commonly estimated with acoustic telemetry (AT) to help inform management and conservation. These behaviors can change with age, habitat and environmental conditions and our ability to accurately estimate them is affected by a study's inference power (design components that affect how accurately detection data represents a species' movements). Red snapper (Lutjanus campechanus) have been extensively studied with AT over a range of time periods and regions, although primarily at artificial reefs (AR). Here, we use large (> 12 km2) acoustic positioning arrays to monitor a study area with low-relief hard bottom, a reef ledge, and an AR. Annual fidelity to the study area was estimated to be 54%, but estimates were affected by fate uncertainty and model choice. Emigration increased with storms and in early summer. Abundance was greatest at small habitat patches but space use did not scale with patch size. Although uncommon, long-distance movements and connectivity between habitats occurred, with a maximum dispersal of 206 km. Previous red snapper AT studies varied greatly in array size, study duration, and number of fish tracked, impacting inference power. This made it difficult to compare results and highlights the need for greater standardization in AT methods.


Conflict of interest statement

Declarations. Competing interests: The authors declare no competing interests. Ethics approval: No specific permission for the tagging protocol was needed as it was conducted by the Florida Fish and Wildlife Conservation Commission’s Fish and Wildlife Research Institute. However, every effort was made to meet all ethical standards.

Figures

Fig. 1
Fig. 1
Map of the west Florida shelf indicating the location of the study site (red box), the 30 m and 90 m depth contours (green), and permitted public artificial reefs in 30–90 m water depths (where red snapper occur), off the west coast of Florida. The inserted box shows the second APS (APS2) array design and sites surveyed with video for fish abundance (pink markers). The three habitats monitored include: (A) the artificial reef (sunken barge); (B) example hard bottom site; and (C) the ledge. Images from the ROV surveys and side scan sonar for each of these habitats are shown to the left.
Fig. 2
Fig. 2
Three receiver arrays were deployed during this study: the first large-scale acoustic positioning system, opportunistic data was retained from one moved receiver, indicated by the red circle (APS1; A), an interim array to monitor tagging sites (B), and a second large-scale APS (APS2; C), with habitat-specific array components indicated by: grey box = hard bottom, royal blue hexagon and ship = the artificial reef, teal box and asterisk = ledge; and the habitat mapped by sidescan; (D). Receiver markers are color-coded to indicate the proportion of realized versus expected days of data collected due to disturbance from shrimpers. 0% indicates a receiver was not retrieved or malfunctioned.
Fig. 3
Fig. 3
Receiver locations in both acoustic positioning system arrays (APS1 and APS2) and all Innovasea-provided fish positions. Known position error from color-coded receivers was used to evaluate if one or more position filtering relationships was needed, i.e., did position error vary within the array. The reference tag location in APS2 is denoted by a black circle.
Fig. 4
Fig. 4
The number of functional receivers by date (top) and detection dates of fish by tagging location (bottom). The first two dashed lines represent APS1 deployment dates and the second two dashed lines represent APS2 deployment dates. Tagging habitat is grey for hardbottom, teal for the ledge, and blue for the artificial reef. Tagging date is denoted by a dot and fish that emigrated are denoted by a star.
Fig. 5
Fig. 5
Although median daily space use was smaller than tracking duration space use for all fish, the amount of overlap in daily space use varied. Here we show the individual variability in daily space use based on 95% utilization distributions (colored by day) for four fish over hard bottom. The degree of daily space use overlap was not correlated with tracking duration: fish 4: 248 d, fish 65: 140 d, fish 45: 322 d, and fish 60: 278 d.
Fig. 6
Fig. 6
Individual space use differed in terms of how many high-use sites (centroids) occurred and the temporal use pattern of centroids (90% UD contours and a minimum size of 100 m2) within tracking duration space use. Four fish exhibited complete shifts in space use. Fish 4 remained over hard bottom but shifted its use to the west. Fish 81 and 82 shifted from the artificial reef (boat icon) to the ledge, and fish 83 shifted from hard bottom to the artificial reef. Tagging locations are indicated by white triangles and final positions by black triangles.
Fig. 7
Fig. 7
Fish positions (with ≤ 20 m position error) from both acoustic positioning arrays categorized by underlying habitat: black = hard bottom, royal blue = artificial reef, teal = ledge, and yellow = sand. Green dots represent live red snapper that left the array but were detected by the glider over nearby hard bottom.
Fig. 8
Fig. 8
Long distance movements (LDMs) and APS2 receiver locations. Movements based on positions are in teal and those based on 4 h COAs are in red. Fish 33, 77, and 81 made two LDMs. Tagging location is indicated by black triangles and LDMs associated with permanent emigration from the array are indicated by red triangles shown next to emigration dates. LDMs not associated with emigration have LDM dates noted in the bottom left corner of each panel.
Fig. 9
Fig. 9
The study area (small red square) versus dispersal area. Dispersal from the study area was detected either by the glider (plane icon) or by hook-and-line recaptures (check mark). Receivers belonging to arrays within the iTAG regional telemetry network in the dispersal area are indicated. Straight lines indicated how emigration path distances were estimated. Green contours indicate water depths of 30 m and 90 m.

References

    1. Lowerre-Barbieri, S. K. et al. Movescapes and eco-evolutionary movement strategies in marine fish: Assessing a connectivity hotspot. Fish Fish.22, 1321–1344 (2021).
    1. Riotte-Lambert, L. & Matthiopoulos, J. Environmental predictability as a cause and consequence of animal movement. Trends Ecol. Evol.35, 163–174 (2020). - PubMed
    1. Werner, E. & Gilliam, J. The Ontogenetic Niche and species interactions in size-structured populations. Annu. Rev. Ecol. Syst.15, 393–425 (1984).
    1. Lowerre-Barbieri, S. K., Burnsed, W., Bickford, J. W. & S. L., and Assessing reproductive behavior important to fisheries management: A case study with red drum, (Sciaenops ocellatus). Ecol. Appl.26, 979–995 (2016). - PubMed
    1. Hussey, N. et al. Aquatic animal telemetry: A panoramic window into the underwater world. Science348, 1255642 (2015). - PubMed

LinkOut - more resources