

Genomic patterns of strain-specific genetic structure, linkage, and selection across fall armyworm populations
- PMID: 39920597
- PMCID: PMC11803928
- DOI: 10.1186/s12864-025-11214-8
Genomic patterns of strain-specific genetic structure, linkage, and selection across fall armyworm populations
Abstract
Background: Molecular genetic approaches have become vital to understanding the evolutionary processes that act on insect pest populations. From mapping the development of resistance to monitoring and predicting pest movement, genomic tools can inform and enhance pest management programs. Here, we used whole genome sequencing population genomics to unravel novel patterns of population structure, linkage, and selection across the genome of a notorious agricultural pest, the fall armyworm.
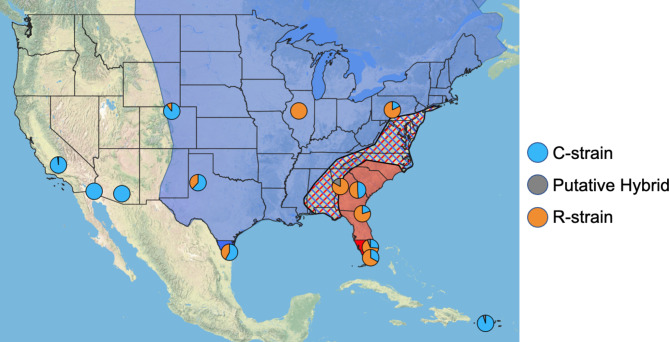
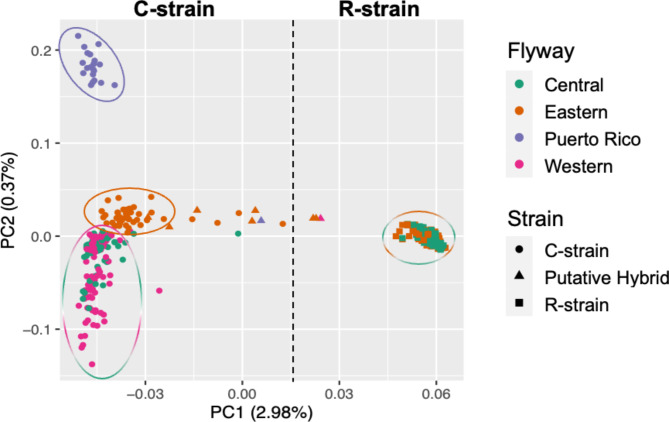
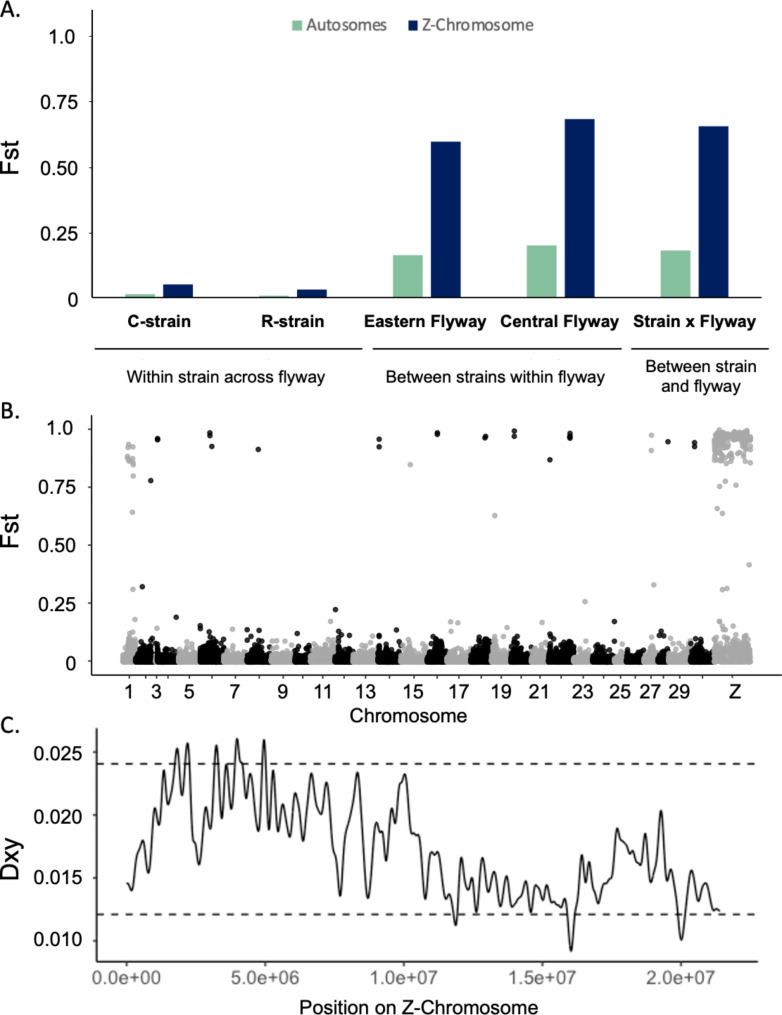
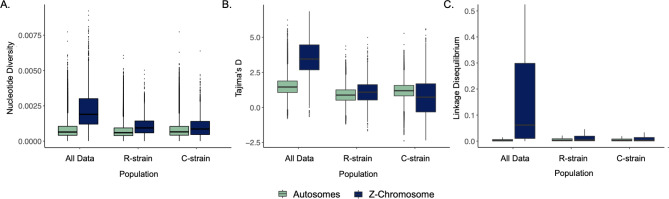
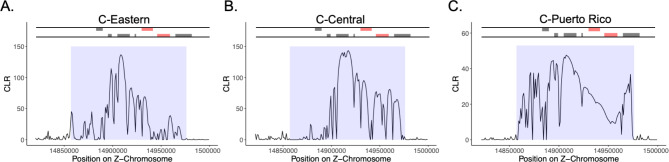
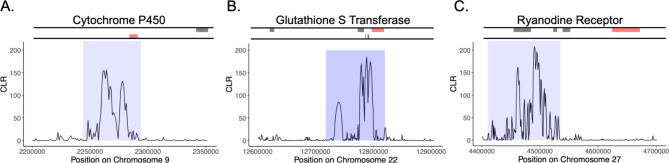
Results: Our data strongly support the existence of two genetically distinct strains of fall armyworm in North America, which have previously been referred to as the C-strain and the R-strain. Although these strains have diverged genetically, we find that differentiation is not uniform across the genome. The Z-chromosome appears to drive divergence between strains with high levels of linkage observed across this chromosome. We also show that a region of the Z-chromosome containing a circadian clock gene implicated in allochronic reproductive isolation is under strain-specific selection. Our data indicates that strains differ in their geographic distributions and exhibit distinct patterns of geographic sub-structuring indicative of unique dispersal patterns. We provide the first evidence for nuclear genomic differentiation between the two major overwintering populations of fall armyworm in the US. Finally, our data reveal population-specific patterns of selection on genomic regions containing putative insecticide resistance alleles, which could relate to their biogeography.
Conclusions: Our results support the existence of the fall armyworm as a pest dyad in the US, with genetically-distinct strains differing in their population structure, dispersal patterns, and genomic signatures of selection on regions likely involved reproductive isolation and insecticide resistance. These differences should be considered when devising and implementing management strategies.
Keywords: Spodoptera frugiperda; Population genomics; Strain divergence; Z-chromosome.
© 2025. The Author(s).
Conflict of interest statement
Declarations. Ethics approval and consent to participate: Not applicable. Consent for publication: Not applicable. Competing interests: The authors declare no competing interests.
Figures
References
-
- Guan F, Zhang J, Shen H, Wang X, Padovan A, Walsh TK, et al. Whole-genome sequencing to detect mutations associated with resistance to insecticides and bt proteins in Spodoptera frugiperda. Insect Sci. 2021;28(3):627–38. 10.1111/1744-7917.12838. - PubMed
-
- Edwards OR, Walsh TK, Metcalfe S, Tay WT, Hoffmann AA, Mangano P, et al. A genomic approach to identify and monitor a novel pyrethroid resistance mutation in the redlegged earth mite, Halotydeus destructor. Pestic Biochem Physiol. 2018;144:83–90. 10.1016/j.pestbp.2017.12.002. - PubMed
-
- Raszick TJ, Perkin LC, Shirley XA, Ruiz-Arce R, Kramer ZA, Suh CPC, et al. Source tracing of Anthonomus grandis captured in areas of the USA where the species had previously been eradicated. J Pest Sci. 2024;97(2):585–95. 10.1007/s10340-023-01656-y.
-
- Izzo VM, Chen YH, Schoville SD, Wang C, Hawthorne DJ. Origin of pest lineages of the Colorado Potato Beetle (Coleoptera: Chrysomelidae). J Econ Entomol. 2018;111(2):868–78. 10.1093/jee/tox367. - PubMed
MeSH terms
Grants and funding
LinkOut - more resources
Full Text Sources
