. 2025 Feb 7;20(1):16.
doi: 10.1186/s13024-024-00792-y.

Loss of MEF2C function by enhancer mutation leads to neuronal mitochondria dysfunction and motor deficits in mice

Affiliations

Loss of MEF2C function by enhancer mutation leads to neuronal mitochondria dysfunction and motor deficits in mice

Ali Yousefian-Jazi et al. Mol Neurodegener. .

Abstract

Background: Amyotrophic lateral sclerosis (ALS) is a fatal neurodegenerative disorder characterized by the loss of both upper and lower motor neurons, leading to progressive paralysis. Both genetic alterations and epigenetic modifications contribute to neuronal dysfunction in the pathogenesis of ALS. However, the mechanism behind genetic mutations in the non-coding region of genes that affect epigenetic modifications remains unclear.

Methods: Convolutional neural network was used to identify an ALS-associated SNP located in the intronic region of MEF2C (rs304152), residing in a putative enhancer element. To examine the alteration of MEF2C transcription by the SNP, we generated HEK293T cells carrying the major or minor allele by CRISPR-Cas9. To verify the role of MEF2C-knockdown (MEF2C-KD) in mice, we developed AAV expressing shRNA for MEF2C based on AAV-U6 promoter vector. Neuropathological alterations of MEF2C-KD mice with mitochondrial dysfunction and motor neuronal damage were observed by confocal microscopy and transmission electron microscope (TEM). Behavioral changes of mice were examined through longitudinal study by tail suspension, inverted grid test and automated gait analysis.

Results: Here, we show that enhancer mutation of MEF2C reduces own gene expression and consequently impairs mitochondrial function in motor neurons. MEF2C localizes and binds to the mitochondria DNA, and directly modulates mitochondria-encoded gene expression. CRISPR/Cas-9-induced mutation of the MEF2C enhancer decreases expression of mitochondria-encoded genes. Moreover, MEF2C mutant cells show reduction of mitochondrial membrane potential, ATP level but elevation of oxidative stress. MEF2C deficiency in the upper and lower motor neurons of mice impairs mitochondria-encoded genes, and leads to mitochondrial metabolic disruption and progressive motor behavioral deficits.

Conclusions: Together, MEF2C dysregulation by the enhancer mutation leads to mitochondrial dysfunction and oxidative stress, which are prevalent features in motor neuronal damage and ALS pathogenesis. This genetic and epigenetic crosstalk mechanism provides insights for advancing our understanding of motor neuron disease and developing effective treatments.

Keywords: Epigenetics; MEF2C; Mitochondria; Motor neuron; Single nucleotide polymorphism (SNP).


Conflict of interest statement

Declarations. Ethics approval and consent participate: All animal (mouse) work and experiments in this study were approved by KIST Institutional Animal Care and Use Committee (IACUC). Consent for publication: All authors have consented for the publication of manuscript. Competing interests: The authors report no competing interests.

Figures
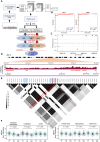
Fig. 1
Fig. 1
Prioritizing rs304152 as a potential functional SNP in intronic region of MEF2C associated with ALS. (A) A research flow starting from ALS and SCZ GWAS meta-analysis data and extracting functional features for each SNP, then using CNN model to initialize the candidate risk-SNPs followed by filtering, target gene assignment and LD sharing steps. (B) The CNN model performance for prediction of testing blocks for ALS and SCZ model. (C) The prediction score for each SNP in the association block contains MEF2C gene body. Green stars are candidate SNPs. (D) Active regulatory regions coverage and peaks marked by H3K27ac in frontal cortex extracted from GTEX IGV browser. (E) The LD plots for the region from 88.7 to 88.9 Mb in chromosome 5 including candidate SNPs. LD block structure was estimated with the Haploview software. The red brocket, rs304152, is the chosen SNP which has the high LD scores with other blue brocket candidate risk-SNPs, rs700587, rs304153 and rs304151. (F) Violin plots of the MEF2C normalized expression level according to alleles of rs304152 in different brain regions. The information was extracted from GTEX database
Fig. 2
Fig. 2
Risk-SNP (rs304152) in the MEF2C gene significantly reduces the transcription of its own gene by inhibiting ATF4 binding to the enhancer region. (A) Schematic representation of constructs used in the luciferase reporter assays. (B) The construct containing the rs304152-G allele (MT) showed approximately 1.7-fold less luciferase activity than the construct containing the rs304152-T allele (WT). The experiment was repeated three times. Statistics were calculated using Two-way ANOVA (n = 4 wells/group: **, P = 0.006; ***, P < 0.001). Error bars represent means ± SEM. (C) A scheme illustrating ChIP-qPCR assay for determining allele-specific DNA–protein interactions of WT and MT form of MEF2C enhancer region with anti-ATF4 antibody in NSC-34 cells. (D) ChIP-qPCR results showed less ATF4 occupancy at the MT form of MEF2C enhancer. Statistics were calculated using Student’s t-test: *, P = 0.01. (E) Immunofluorescence staining for ATF4 (red) and MEF2C (green) in NSC-34 cells transfected with ATF4 for 12 h. Right: quantification of ATF4 and MEF2C immunoreactivity levels. A total of 21 cells/group were counted (7 cells/well) from n = 3 wells/group (NSC-34 and NSC-34 + ATF4). Statistics were calculated using linear mixed model (LMM) (***, P < 0.001). (F) The scatter plot showed a correlation between ATF4 and MEF2C immunoreactivity levels in the cells. (G) A scheme summarizing that the mutant form of MEF2C enhancer resulted in MEF2C transcriptional impairment by inhibiting ATF4 transcription factor binding to the enhancer region. Scheme created with BioRender.com
Fig. 3
Fig. 3
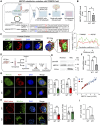
MEF2C enhancer mutation impairs MEF2C transcription and leads to mitochondrial dysfunction. (A) Demonstration of CRISPR-editing of rs304152-G mutation in HEK293T cells. Underlined sequence and blue sequence determine sgRNA and PAM, respectively. Scheme created with BioRender.com. (B) MEF2C mRNA level decreased in rs304152-G (MT) cells compared to rs304152-T (WT) cells. Statistics were calculated using Student’s t-test: *, P = 0.047. (C) Immunofluorescence staining of MEF2C (green) and outer mitochondria membrane marker, TOMM20 (red), in human cortical pyramidal neuron along with deconvolved and 3D reconstruction image made by Imaris 9 (Bitplane). Right panel shows line measurement analysis for MEF2C and TOMM20 colocalization signals. White dotted line indicates the colocalization analysis line. (D) Ultrafractionation of cellular compartments of mouse brain tissues. (E) Western blots of cell fractionation confirmed the presence of MEF2C in mitochondria in pure mitochondrial fractions. (F) qPCR results showed decrease of ND4 mRNA levels in MT cells. Statistics were calculated using Student’s t-test: **, P < 0.002. (G) Immunofluorescence staining of MEF2C and ND4 in WT and MT cells. Scale bars (white): 5 μm. Right: densitometry analysis showed decrease of MEF2C and ND4 levels in MT cells. Scatter plot represents positive correlation between MEF2C and ND4 levels. A total of 39 cells/group were counted (13 cells/well) from n = 3 wells/group (WT and MT). Statistics were calculated using LMM (***, P < 0.001). (H) Immunostaining of MitoTracker (red) and MitoSox (green) in WT and MT cells. The nuclei were counterstained with DAPI (blue). Right: quantification of MitoTracker and MitoSox levels. A total of 36 cells/group were counted (12 cells/well) from n = 3 wells/group (WT and MT). Statistics were calculated using LMM (*, P = 0.037; ***, P < 0.001). (I) Decrease of ATP level in MT cells compared to WT cells. The experiment was repeated three times. Statistics were calculated using Student’s t-test (**, P = 0.006). Error bars represent means ± SEM
Fig. 4
Fig. 4
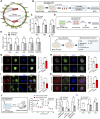
MEF2C regulates mitochondria gene expression and mitochondrial function in motor neuron cell line (NSC-34). (A) MEF2C transcription factor binding sites at mouse mitochondrial DNA detected by TRANSFAC 6.0-based algorithm, Patch 1.0. (B) A scheme illustrating performing MEF2C ChIP assay on NSC-34 cells infected by Mef2c-KD (shMef2c) and control (shControl) viruses, and measuring level of specific DNA in ChIP samples in mitochondria genes by qPCR. (C) MEF2C ChIP-qPCR showed Mef2c occupancy level in Nd2, Nd4 and Nd5 mitochondrial genes in shControl and shMef2c cells. Data generated from 3 samples which are duplicated and normalized to input DNA. Statistics were calculated using Student’s t-test (ND2, *, P = 0.04;  ND4, *, P = 0.047; ND5, *, P = 0.05). (D) A scheme illustrating performing qPCR on NSC-34 cells infected by shControl and shMef2c viruses and harvested after 24 h. (E) qPCR results showed mRNA level of mitochondria genes, Nd2, Nd4, Nd5, decreased by Mef2c-KD. Statistics were calculated using Student’s t-test (ND2, *, P = 0.035; ND4, *, P = 0.05; ND5, **, P = 0.025). (F) A scheme illustrating a series of experiments to evaluate mitochondrial function in in NSC-34 cells infected by Mef2c-KD virus. Immunostaining of (G) MitoSox (red), (H) MitoTracker (red) and (I) cytochrome c (Cyto c) (red) in GFP+ NSC-34 cells infected by Mef2c-KD virus. The nuclei were counterstained with DAPI (blue). Scale bars (white): 5 μm. Right: quantification of MitoSox, MitoTracker and cytochrome c levels in GFP+ cells. A total of 30 cells/group were counted (10 cells/well) from n = 3 wells/group (shControl and shMef2c). Statistics were calculated using LMM (*, P = 0.012; ***, P < 0.001). (J) Cellular respiration rate of differentiated NSC-34 cells infected by Mef2c-KD virus measured by a Seahorse XFe24 analyzer. Right: quantitative analysis of the basal and maximum respiratory rate, and ATP production amount of GFP+ cells. Statistics were calculated using Student’s t-test (n = 4 wells/group: *, P < 0.05 ,). (K) Immunofluorescence staining of cleaved caspase-3 in NSC-34 cells infected by Mef2c-KD virus. Scale bars (white): 5 μm. Right: densitometry analysis for GFP+ cells. A total of 30 cells/group were counted (10 cells/well) from n = 3 wells/group (shControl and shMef2c). Statistics were calculated using LMM (***, P < 0.001). (L) Decrease of ATP level by Mef2c-KD at 24, 48 and 72 h after the virus infection in NSC-34 cells. Statistics were calculated using Student’s t-test (n = 4 wells/group: P = 0.097 at 24 h; *, P = 0.025 at 48 h; *, P = 0.023 at 72 h). Error bars represent means ± SEM
Fig. 5
Fig. 5
Mef2c-KD induces mitochondrial dysfunction and motor neuronal damage, and alters motor neuron excitability in the cortical layer V of mice. (A) The pAAV-hSyn(pro)-shControl-GFP (shControl) or pAAV-hSyn(pro)-shMef2c-GFP (shMef2c) viruses was delivered into cortical layer V by bilateral stereotaxic injection method. (B) Immunostaining of ND4 and DAPI in shControl and shMef2c mice. Scale bars (white): 5 μm. Right: densitometry analysis of ND4 immunoreactivity level in GFP+ cells. A total of 30 cells/group were counted (6 cells/mouse) from N = 5 mice/group (shControl and shMef2c). Statistics were calculated using Student’s t-test (*, P  < 0.05). (C) Immunostaining of DRP1 and TOMM20 in shControl and shMef2c mice. Scale bars (white): 5 μm. Right: skeletonized images of mitochondria morphological structure using TOMM20 signals, and densitometry analysis of DRP1 immunoreactivity level in mitochondria of GFP+ cells. A total of 30 cells/group were counted(6 cells/mouse) from N = 5 mice/group (shControl and shMef2c). Statistics were calculated using Student’s t-test (***, P < 0.001). (D) Line measurement analysis for DRP1 and TOMM20 colocalization signals in shControl and shMef2c-transduced cortical pyramidal neuron. (E) Results of mitochondria network size analysis performed by MiNA plugin in Fiji ImageJ software. A total of 10 cells/group were counted (2 cells/mouse) from N = 5 mice/group (shControl and shMef2c). Statistics were calculated using Student’s t-test (**, P = 0.003). (F) Representative TEM images showed the presence of immunogold particles (red head arrows) in mitochondria of the pyramidal neurons layer V in shControl mice. Scale bars: 200 nm. (G) Representative TEM images showed mitochondria fission in shMef2c group. Scale bars: 2 μm. Right: a normalized curve for quantitative analysis of mitochondria size in the cortical pyramidal neurons of shControl and shMef2c mice. A total of n = 200 mitochondria/20 neurons/group were counted from N = 5 mice/group (shControl and shMef2c). (H) Immunostaining of CTIP2 in shControl and shMef2c mice. Scale bars: 5 μm. (I) Quantification analysis on the cell size of cortical layer V pyramidal neurons in GFP+ cells. A total of 15 cells/group were counted (3 cells/mouse) from N = 5 mice/group (shControl and shMef2c). Statistics were calculated using Student’s t-test (*, P  < 0.05). (J) A scheme illustrating performing whole-cell patch clamp on cortical layer V pyramidal neurons for shControl and shMef2c mice. (K) Representative recordings of action potentials from motor cortex layer V pyramidal neurons induced by step current injection, ranging from 0 to 330 pA (Scale bar: 20 mV, 200 ms). (L) shMef2c increased the number of action potentials triggered by a series of current injection (30-pA increment, 12 steps). shControl, n = 13 neurons/4 mice; shMef2c, n = 11 neurons/4 mice). Statistics were calculated using Student’s t-test (60(pA), P = 0.438; 90(pA), P = 0.088; 120(pA), *, P = 0.013; 150(pA), **, P = 0.009; 180(pA), **, P = 0.01; 210(pA), **, P = 0.001; 240(pA), **, P = 0.001; 270(pA), **, P = 0.002; 300(pA), **, P = 0.002; 330(pA), *, P = 0.03). (M) Representative traces of individual action potential (Scale bar: 20 mV, 50 ms). (N) The threshold to initiate action potentials is not altered in shMef2c group (shControl, n = 13 neurons/4 mice; shMef2c, n = 11 neurons/4 mice). Statistics were calculated using Student’s t-test, P = 0.828. Error bars represent means ± SEM
Fig. 6
Fig. 6
Mef2c-KD shows motor neuron disease-like behaviors in mice. (A) A scheme illustrating delivery of AAV-shRNA-Control-GFP (shControl) or AAV-shRNA-Mef2c-GFP (shMef2c) viruses into the cortical layer V of WT mice and performing longitudinal behavioral study 3, 6 and 9 weeks after injection. (B) Representative still images of the tail suspension test for shControl and shMef2c-transduced mice. (C) The number of forelimbs clasping in tail suspension test in 3-, 6- and 9-weeks post-injection. Statistics were calculated using repeated measures ANOVA (N = 5 mice/group for shControl and shMef2c) (3weeks, P = 0.51; 6 and 9weeks, ***, P < 0.001). (D) Aggregated coordinate plots in the first 10 s of tail suspension test for shControl and shMef2c-transduced mice. (E) A representative still image of the inverted grid test. Right: the minimal holding impulse. Statistics were calculated using repeated measures ANOVA (N = 5 mice/group for shControl and shMef2c) (3weeks, P = 0.387; 6weeks, P = 0.37; 9weeks, P = 0.848). (F)  A representative still image of the accelerated wheel test. Bottom: the computer-assisted footprint in wheel running test for a representative mouse in each group. (G) Gait analysis showed shorter stride length and wider stride width in shMef2c mice. Statistics were calculated using repeated measures ANOVA (N = 5 mice/group for shControl and shMef2c, n = 10 steps/mouse). Significantly different at *, P < 0.05; **, P <0.01. Error bars represent means ± SEM. (H) A scheme proposing how MEF2C enhancer SNP impairs MEF2C transcription, resulting in mitochondrial dysfunction and inducing oxidative stress which makes motor neuronal damage and motor deficit. Scheme created with BioRender.com

Update of

References

    1. Haukedal H, Freude K. Implications of Microglia in Amyotrophic lateral sclerosis and Frontotemporal Dementia. J Mol Biol. 2019;431(9):1818–29. - PubMed
    1. Yousefian-Jazi A, Seol Y, Kim J, Ryu HL, Lee J, Ryu H. Pathogenic genome signatures that damage motor neurons in amyotrophic lateral sclerosis. Cells. 2020;9(12):2687. - PMC - PubMed
    1. Belzil VV, Bauer PO, Prudencio M, Gendron TF, Stetler CT, Yan IK, Pregent L, Daughrity L, Baker MC, Rademakers R, et al. Reduced C9orf72 gene expression in c9FTD/ALS is caused by histone trimethylation, an epigenetic event detectable in blood. Acta Neuropathol. 2013;126(6):895–905. - PMC - PubMed
    1. Belzil VV, Bauer PO, Gendron TF, Murray ME, Dickson D, Petrucelli L. Characterization of DNA hypermethylation in the cerebellum of c9FTD/ALS patients. Brain Res. 2014;1584:15–21. - PMC - PubMed
    1. Xi Z, Rainero I, Rubino E, Pinessi L, Bruni AC, Maletta RG, Nacmias B, Sorbi S, Galimberti D, Surace EI, et al. Hypermethylation of the CpG-island near the C9orf72 G₄C₂-repeat expansion in FTLD patients. Hum Mol Genet. 2014;23(21):5630–7. - PubMed

Substances

LinkOut - more resources