

Technique selection and technical developments for 2D dual-energy subtraction angiography on an interventional C-arm
- PMID: 39920906
- PMCID: PMC12059545
- DOI: 10.1002/mp.17661
Technique selection and technical developments for 2D dual-energy subtraction angiography on an interventional C-arm
Abstract
Background: Dual-energy (DE) x-ray image acquisition has the potential to provide material-specific angiographic images in the interventional suite. This approach can be implemented with novel detector technologies, such as dual-layer and photon-counting detectors. Alternatively, DE imaging can be implemented on existing systems using fast kV-switching. Currently, there are no commercially available DE options for interventional platforms.
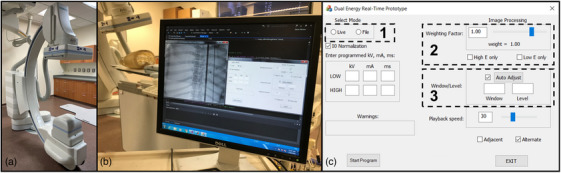
Purpose: This study reports on the development of a prototype fast kV-switching DE subtraction angiography system. In contrast to alternative approaches to DE imaging in the interventional suite, this prototype uses a clinically available interventional C-arm equipped with special x-ray tube control software. An automatic exposure control algorithm and technical features needed for such a system in the interventional setting are developed and validated in phantom studies.
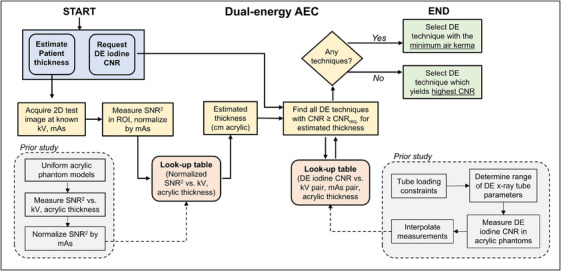
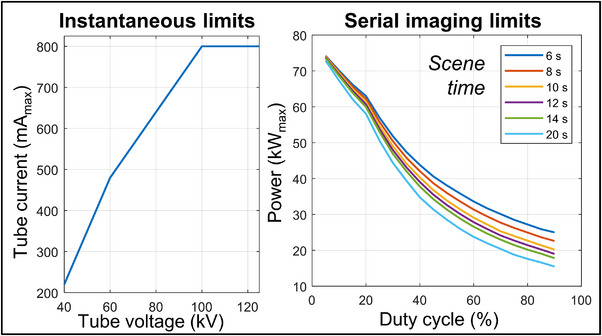
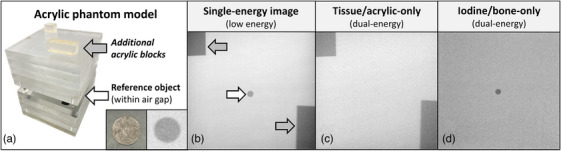
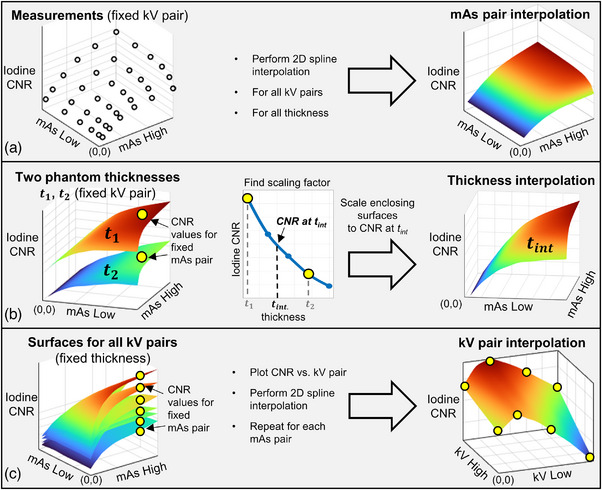
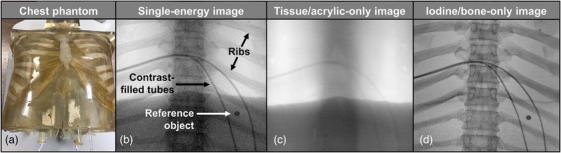
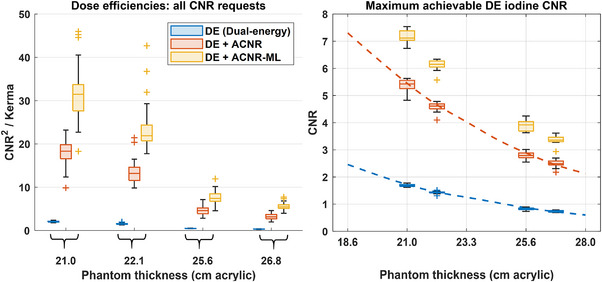
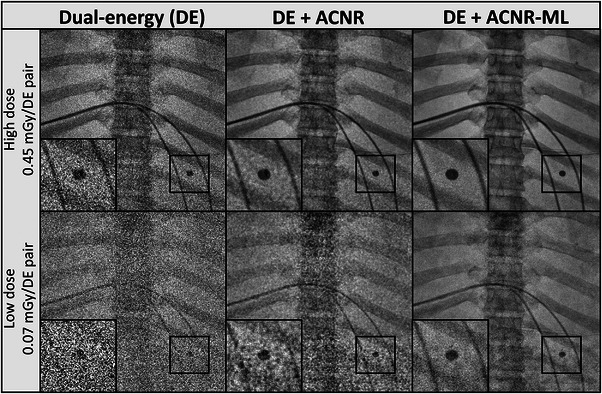
Methods: Fast kV-switching was implemented on an interventional C-arm platform using software that enables frame-by-frame specification of x-ray tube techniques (e.g., tube voltage/kV, pulse width/ms, tube current/mA). A real-time image display was developed on a portable workstation to display DE subtraction images in real-time (nominal 15 frame/s). An empirical CNR-driven automatic exposure control (AEC) algorithm was created to guide DE tube technique selection (kV pair, ms pair, mA). The AEC model contained a look-up table which related DE tube technique parameters and air kerma to iodine CNR, which was measured in acrylic phantom models containing an iodine-equivalent reference object. For a given iodine CNR request, the AEC algorithm estimated patient thickness and then selected the DE tube technique expected to deliver the requested CNR at the minimum air kerma. The AEC algorithm was developed for DE imaging performed without and with the application of anti-correlated noise reduction (ACNR). Validation of the AEC model was performed by comparing the AEC-predicted iodine CNR values with directly measured values in a separate phantom study. Both dose efficiency (CNR2/kerma) and maximum achievable iodine CNR (within tube technique constraints) were quantified. Finally, improvements in DE iodine CNR were quantified using a novel variant to the ACNR approach, which used machine-learning image denoising (ACNR-ML).
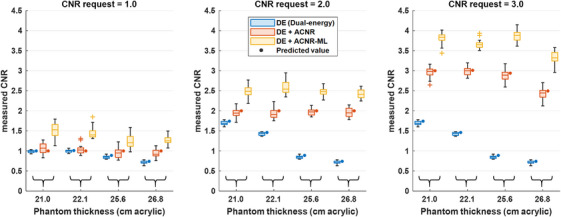
Results: The prototype system provided a continuous display of DE subtraction images. For standard DE imaging, the AEC-predicted iodine CNR values agreed with directly measured values to within 3.5% ± 1.6% (mean ± standard deviation). When ACNR was applied, predicted iodine CNR agreed with measurement to within 2.1% ± 3.3%. AEC-generated DE techniques were typically (low/high energy): 63/125 kV, 10/3.2 ms, with varying mA values. When ACNR was applied, dose efficiency was increased by a factor of 9.37 ± 2.08 and maximum CNR was increased by a factor of 3.29 ± 0.21 relative to DE without denoising. Application of ACNR-ML yielded a greater increase in both the dose efficiency (16.11 ± 2.99) and maximum CNR (4.46 ± 0.31) compared to DE without denoising.
Conclusion: A prototype DE subtraction angiography system using fast kV-switching was implemented on a clinically available interventional C-arm platform without modification of system hardware. The technical features presented in this work include a real-time image display, noise-reduction strategies, and a CNR-driven AEC algorithm. This prototype system demonstrates the feasibility of 2D dual-energy imaging for image-guided interventions.
Keywords: angiography; dual‐energy; interventional imaging.
© 2025 The Author(s). Medical Physics published by Wiley Periodicals LLC on behalf of American Association of Physicists in Medicine.
Conflict of interest statement
Authors Michael Speidel and Paul Laeseke have sponsored research agreements with Siemens Healthineers. James Scheuermann is a full‐time employee of Siemens Healthineers.
Figures
Similar articles
-
Fast kV-switching and dual-layer flat-panel detector enabled cone-beam CT joint spectral imaging.Phys Med Biol. 2024 May 14;69(11). doi: 10.1088/1361-6560/ad40f3. Phys Med Biol. 2024. PMID: 38640917
-
Dual energy CT reconstruction using the constrained one step spectral image reconstruction algorithm.Med Phys. 2024 Apr;51(4):2648-2664. doi: 10.1002/mp.16788. Epub 2023 Oct 14. Med Phys. 2024. PMID: 37837648 Free PMC article.
-
Use of a deep learning neural network to generate bone suppressed images for markerless lung tumor tracking.Med Phys. 2025 Jul;52(7):e17949. doi: 10.1002/mp.17949. Med Phys. 2025. PMID: 40660921 Free PMC article.
-
Management of urinary stones by experts in stone disease (ESD 2025).Arch Ital Urol Androl. 2025 Jun 30;97(2):14085. doi: 10.4081/aiua.2025.14085. Epub 2025 Jun 30. Arch Ital Urol Androl. 2025. PMID: 40583613 Review.
-
Signs and symptoms to determine if a patient presenting in primary care or hospital outpatient settings has COVID-19.Cochrane Database Syst Rev. 2022 May 20;5(5):CD013665. doi: 10.1002/14651858.CD013665.pub3. Cochrane Database Syst Rev. 2022. PMID: 35593186 Free PMC article.
References
-
- Fischbach F, Freund T, Röttgen R, Engert U, Felix R, Ricke J. Dual‐energy chest radiography with a flat‐panel digital detector: revealing calcified chest abnormalities. Am J Roentgenol. 2003;181(6):1519‐1524. - PubMed
-
- Gilkeson RC, Sachs PB. Dual energy subtraction digital radiography: technical considerations, clinical applications, and imaging pitfalls. J Thorac Imaging. 2006;21(4):303‐313. doi: 10.1097/01.rti.0000213646.34417.be - DOI - PubMed
MeSH terms
Grants and funding
LinkOut - more resources
Full Text Sources
