. 2025 Mar;12(12):e2412517.
doi: 10.1002/advs.202412517. Epub 2025 Feb 7.

GNE-317 Reverses MSN-Mediated Proneural-to-Mesenchymal Transition and Suppresses Chemoradiotherapy Resistance in Glioblastoma via PI3K/mTOR

Affiliations

GNE-317 Reverses MSN-Mediated Proneural-to-Mesenchymal Transition and Suppresses Chemoradiotherapy Resistance in Glioblastoma via PI3K/mTOR

Yong-Chang Yang et al. Adv Sci (Weinh). 2025 Mar.

Abstract

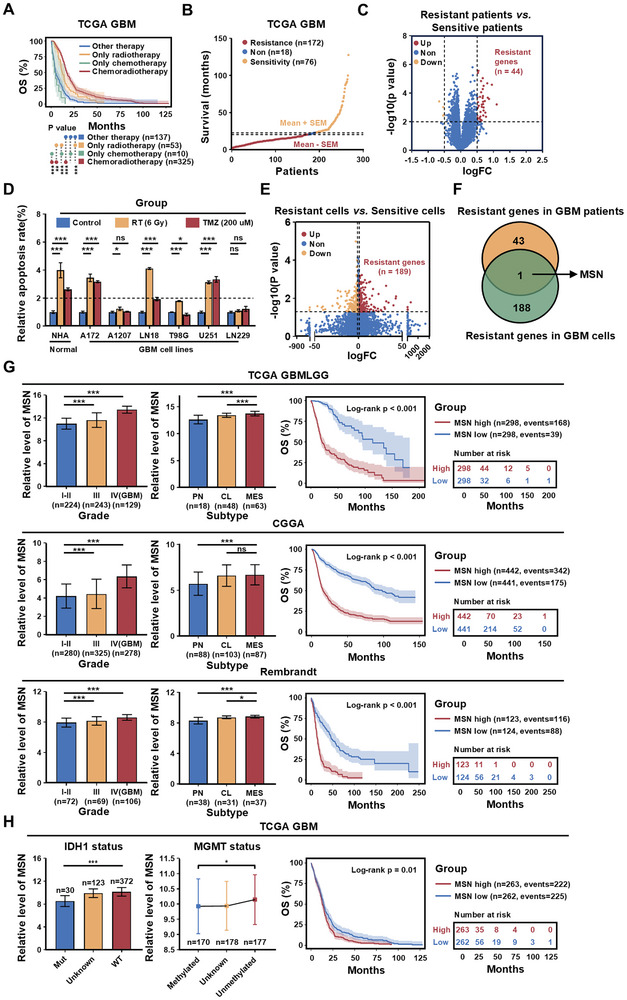
Glioblastoma (GBM) resistance to chemoradiotherapy is a major factor contributing to poor treatment outcomes. This resistance markedly affects the effectiveness of surgery combined with chemoradiotherapy and leads to post-surgical tumor recurrence. Therefore, exploring the mechanisms underlying chemoradiotherapy resistance in GBM is crucial for understanding its progression and improving therapeutic options. This study found that moesin (MSN) acts as a key promotor of chemoradiotherapy resistance in glioma stem cells (GSCs), enhancing their proliferation and stemness maintenance. Mechanistically, MSN activates the downstream PI3K/mTOR signaling pathway, driving the proneural-to-mesenchymal transition (PMT) in GSCs. This process enhances the repair of DNA damage caused by radiotherapy (RT) and temozolomide (TMZ), thereby increasing the resistance of GSCs to chemoradiotherapy. Additionally, GNE-317, a small molecule drug capable of crossing the blood-brain barrier, specifically inhibits MSN and suppresses the activation of downstream PI3K/mTOR signaling. Importantly, the combination of GNE-317 with RT and TMZ exhibits a strong synergistic effect both in vivo and in vitro, achieving better efficacy compared to the traditional combination of RT and TMZ. This study not only advances understanding of the mechanisms underlying chemoradiotherapy resistance in GBM but also provides a promising new approach for enhancing treatment outcomes.

Keywords: GNE‐317; MSN; PI3K/mTOR; chemoradiotherapy resistance; glioblastoma; proneural‐to‐mesenchymal transition.


Conflict of interest statement

The authors declare no conflict of interest.

Figures

Figure 1
Figure 1
MSN may be a key factor in chemoradiotherapy resistance in GBM. A) Kaplan‐Meier survival curves showing the association between standard chemoradiotherapy and prognosis in GBM patients in the TCGA GBM database. (Other therapy, n = 137; Only radiotherapy, n = 53; Only chemotherapy, n = 10; Chemoradiotherapy, n = 325). P values were calculated using the log‐rank test. ** p < 0.01, *** p < 0.001. B) Scatter plot of patients who received standard chemoradiotherapy and had an outcome of death (n = 266), divided into sensitivity (n = 76) and resistance (n = 172) groups based on survival time. Data are shown as mean ± SEM. C) Volcano plot comparing resistant and sensitive patients. Red indicates chemoradiotherapy‐resistant genes, and yellow indicates chemoradiotherapy‐sensitive genes. The x‐axis represents log2(fold change), and the y‐axis represents ‐log10(p value). D) Quantification of apoptosis levels in one normal cell line and six GBM cell lines after control, RT, or TMZ treatment. Data are shown as mean ± SD. * p < 0.05, *** p < 0.001, ns, p > 0.05; two‐tailed unpaired t‐test. E) Volcano plot showing differential genes between resistant and sensitive cells. Red indicates chemoradiotherapy‐resistant genes, and yellow indicates chemoradiotherapy‐sensitive genes. F) Venn diagram showing chemoradiotherapy‐resistant genes common to both GBM cells and GBM patients. G) MSN expression in different grades and subtypes, and its association with survival outcomes in the glioma database (TCGA GBMLGG, CGGA, and Rembrandt). Bar chart data are shown as mean ± SD. * p < 0.05, *** p < 0.001, ns, p > 0.05; two‐tailed unpaired t‐test. For survival analysis, p values were calculated using the log‐rank test. H) MSN expression and prognosis in GBM patients with different IDH1 and MGMT status. Bar and box chart data are shown as mean ± SD. * p < 0.05, *** p < 0.001; two‐tailed unpaired t‐test. For survival analysis, p values were calculated using the log‐rank test.
Figure 2
Figure 2
MSN enhances chemoradiotherapy resistance in GBM patients and GSCs. A) Grade information and HE staining of glioma TMAs. Black circles indicate TMA spots excluded due to hemorrhage. B) Representative images and quantification of MSN expression in TMAs, grouped by glioma grades. Data are shown as mean ± SEM. *** p < 0.001; two‐tailed unpaired t‐test. C) Kaplan‐Meier survival curves for patients stratified by median MSN expression levels in grade IV glioma (GBM). Censored data are represented by vertical lines. P values were calculated using the log‐rank test. D) Bar chart showing the survival status of GBM patients after standard chemoradiotherapy. E) Scatter plot showing patients who received standard chemoradiotherapy and had an outcome of death, divided into chemoradiotherapy‐sensitive and chemoradiotherapy‐resistant groups based on median survival time. F) Scatter plot showing MSN expression levels in chemoradiotherapy‐sensitive and chemoradiotherapy‐resistant groups. Data are shown as mean ± SEM. * p < 0.05; two‐tailed unpaired t‐test. G) Kaplan‐Meier survival curves for chemoradiotherapy‐sensitive and chemoradiotherapy‐resistant groups. P values were calculated using the log‐rank test. H) Bar graph showing relative mRNA expression levels of MSN in normal tissues and GSCs by qPCR. Data are shown as mean ± SEM. n = 3 independent experiments. I) qPCR and J) immunoblot analysis of MSN expression in GSCs transduced with non‐targeting shRNA (shNT) or MSN shRNA (shMSN). qPCR data are shown as mean ± SEM. n = 3 independent experiments. *** p < 0.001; two‐tailed unpaired t‐test. K) Cell viability assay of GSC924 transduced with shNT or shMSN, treated with different doses of RT or varying concentrations of TMZ for 48 h. n = 3 biological independent samples. The black dashed line represents the IC50 value. * p < 0.02, ** p < 0.01, *** p < 0.001; two‐way ANOVA followed by Tukey's multiple comparison test. L) Representative images and M) quantification of γ‐H2AX staining in GSC924 with or without RT treatment (6 Gy, 48 h) or TMZ (200 µm, 48 h). Scale bar: 10 µm. Data are shown as mean ± SEM. n = 5 independent experiments. *** p < 0.001, ns, p > 0.05; two‐tailed unpaired t‐test. N) Immunoblot analysis of γ‐H2AX and cleaved Caspase‐3 expression in GSC924 with or without RT (6 Gy, 48 h) or TMZ (200 µm, 48 h) treatment. O) Relative mRNA levels of DNA repair‐related genes in GSC924 with or without RT (6 Gy, 48 h) or TMZ (200 µm, 48 h) treatment. Data are shown as mean ± SEM. n = 3 independent experiments. * p < 0.05, ** p < 0.01, *** p < 0.001; two‐tailed unpaired t‐test.
Figure 3
Figure 3
MSN is required for GSC proliferation and self‐renewal. A) Cell viability assay of GSCs transduced with shNT or shMSN. n = 6 (GSC924) or n = 6 (GSC628) biological independent samples. Data are shown as mean ± SD. *** p < 0.001, two‐way ANOVA followed by Tukey's multiple comparison test. B) Two independent shRNAs targeting MSN reduced the growth of GSC924 and GSC628 compared to shNT, as measured by cell count. Data are shown as mean ± SD from 5 independent experiments. * p < 0.05, ** p < 0.01, *** p < 0.001, ns, p > 0.05; two‐way ANOVA followed by Tukey's multiple comparison test. C) Representative images of tumorspheres from GSCs transduced with shNT or shMSN. Scale bar: 150 µm. D) Quantification of tumorsphere numbers and average clone diameter in GSCs transduced with shNT or shMSN. n = 16 for tumorsphere number, n = 5 biological independent cell cultures for average clone diameter. Data are shown as mean ± SEM. *** p < 0.001; two‐tailed unpaired t‐test. E) In vitro extreme limiting dilution analysis of tumorsphere formation in GSCs expressing shNT or shMSN. n = 16 biological independent cell cultures. *** p < 0.001 by ELDA analysis. F) Immunoblot analysis of MSN expression in GSC727‐1‐Vector and GSC727‐1‐MSN‐overexpression (MSN‐OE) through lentiviral infection. G) Cell viability assay, H) representative images of tumorspheres, and I) extreme limiting dilution analysis of tumorsphere formation in GSC727‐1 expressing vector or MSN‐OE. J) Representative images and K) quantification of relative luciferase on days 7, 14, 21, and 28 post‐transplantation; bioluminescence is measured in p−1s−1cm2‐1sr. GSC924: shNT (n = 5), shMSN‐1 (n = 5), shMSN‐2 (n = 5). Data are shown as mean ± SEM. * p < 0.05, *** p < 0.001; one‐way ANOVA followed by Tukey's multiple comparison test. L) Kaplan‐Meier survival curves of mice bearing GSC924‐derived xenografts expressing shNT or shMSN. *** p < 0.001, log‐rank test. GSC924: shNT (n = 10), shMSN‐1 (n = 10), shMSN‐2 (n = 10).
Figure 4
Figure 4
At the single‐cell level, MSN is highly correlated with chemoradiotherapy resistance. A) Basic information about single‐cell sequencing. B) Cell filtering excludes non‐single cells using DoubletFinder. C) t‐SNE analysis of all cells, showing 19 significant cell clusters color‐coded and labeled accordingly. D) RNA‐derived single‐cell CNV information. Cell clusters were classified as CNV and CNV+ based on CNV score. E) Dot plot of cell clusters, showing shared and specific marker genes, dividing clusters into non‐tumor 1, non‐tumor 2, glioma, and lung cancer metastasis (LC‐meta) cells. F) t‐SNE visualization of the Gliomap, including patient data, grades (WHO II, Gliosarcoma (GS), and WHO IV), and subdivisions of non‐tumor and glioma subclusters. The axis outside the circular plot displays the log scale of total cell numbers for each cell type (level‐3 annotation). G) Pie chart showing the proportion of glioma cells originating from patients of different grades. H) Distribution of MSN expression on the original t‐SNE coordinates for 14 glioma subclusters. I) Scatter plot showing MSN expression levels in patients with low (WHO II) and high grades (GS and WHO IV). The black line represents the mean value. *** p < 0.001, two‐tailed unpaired t‐test. J) Bar chart showing MSN expression across 14 glioma subclusters, categorized as high MSN (mean + SEM) and low MSN (mean – SEM) groups. K) Scatter plot showing enrichment scores of the chemoradiotherapy‐resistance signature, categorizing glioma subclusters into chemoradiotherapy‐resistant (mean + SEM) and chemoradiotherapy‐sensitive (mean – SEM) groups. L) Venn diagram showing high‐MSN chemoradiotherapy‐resistant and low‐MSN chemoradiotherapy‐sensitive glioma subclusters. M) Distribution of high‐MSN‐resistance and low‐MSN‐sensitivity groups on the original t‐SNE coordinates. N) Pie charts showing the proportions of cells from low‐MSN chemoradiotherapy‐sensitive and high‐MSN chemoradiotherapy‐resistant glioma subclusters in glioma patients of different grades.
Figure 5
Figure 5
Combined analysis indicates that high‐MSN chemoradiotherapy‐resistant cell subclusters are predominantly distributed in the MES‐like cells region. A) Schematic of integrated analysis combining glioma single‐cell sequencing and GBM spatial transcriptomics. B) The heatmap shows the matching between scRNA clusters and spatial transcriptomics data. In the scRNA clusters, red clusters indicate high‐MSN chemoradiotherapy‐resistant groups, while blue clusters represent low‐MSN chemoradiotherapy‐sensitive groups. C) Spatial distribution of high‐MSN chemoradiotherapy‐resistant and low‐MSN chemoradiotherapy‐sensitive subclusters. D) The bar chart represents the enrichment scores of high‐MSN chemoradiotherapy‐resistant and low‐MSN chemoradiotherapy‐sensitive groups in different regions of the Ivy GAP database. CT: Cellular Tµmor; IT: Infiltrating Tµmor; LE: Leading Edge; MP: Microvascular Proliferation; PSEU: Pseudopalisading cells. Data are presented as mean ± SD. Spatial distribution of E) 4 cell states scores defined by scRNA‐seq and F) MES marker.
Figure 6
Figure 6
MSN promotes the proneural‐to‐mesenchymal transition to resist chemoradiotherapy. A) The scatter plot shows MSN expression levels across different GBM subtypes in the TCGA GBM database. Data are presented as mean ± SD. *** p < 0.001, two‐tailed unpaired t‐test. B) The scatter plot divides patients into high‐MSN (Mean + SEM) and low‐MSN (Mean – SEM) groups based on MSN expression levels. C) GSEA enrichment analysis of high‐MSN and low‐MSN groups in the TCGA GBM database. D) The left heatmap shows the correlation analysis between MSN and subtype signature genes, while the right pie chart represents the correlation analysis between MSN and subtype marker genes. E) qPCR analysis is used to determine the subtypes of different GSCs. F) Schematic of the CD44 reporter system. G) Representative images and quantitative analysis of CD44 reporter system luciferase in GSCs transduced with shNT or shMSN. n = 5 (GSC924) or n = 5 (GSC628) biological independent samples. Data are presented as mean ± SEM. *** p < 0.001, two‐tailed unpaired t‐test. H) Immunoblot analysis of subtype markers in GSCs transduced with shNT or shMSN. I) Immunoblot analysis of key MES transcriptional regulators and pathways in GSCs transduced with shNT or shMSN. J) Multiplex immunofluorescence staining of TMAs in GBM, dividing GBM patients into MES or PN subtypes. The left side shows the immunohistochemical staining of MSN. K) The bar chart shows the MSN H‐score in MES and PN subtype patients. Data are presented as mean ± SEM. ** p < 0.01, two‐tailed unpaired t‐test. L) Kaplan–Meier curves of survival for different subtypes of patients. Censored data is represented by vertical lines in the graph. P value is calculated using the log‐rank test. M) The bar chart represents the number of cases from patients who received standard chemoradiotherapy and had an outcome of death in MES and PN subtypes. N) Kaplan–Meier curves of survival for patients selected in M), stratified by subtype in GBM TMAs. P value is calculated using the log‐rank test.
Figure 7
Figure 7
GNE‐317 enhances sensitivity to RT and TMZ by inhibiting MSN in GSCs. A) The scatter plot shows 33 glioma cells divided into high‐MSN (Mean + SEM) and low‐MSN (Mean – SEM) groups based on MSN expression levels. B) The volcano plot shows differential IC50 values of 141 drugs between high‐MSN and low‐MSN group cells. Red dots represent drugs sensitive to MSN. The x‐axis and y‐axis represent log2 (fold change) and –log10 (p value), respectively. C) The heatmap shows the relative IC50 value of 13 drugs sensitive to MSN in high MSN and low MSN groups. Red drug indicates the ability to cross the blood‐brain barrier. D) Immunoblot and E) qPCR analyses of the inhibitory effect of different concentrations of GNE‐317 on MSN at protein and RNA level in GSCs. F) Molecular docking analysis (3D Binding model) of Moesin protein (PDB:8CIU) with GEN‐317. GEN‐317 is shown as brick red sticks. The key residues are shown as blue sticks. Hydrogen bonds are shown as yellow dashed lines. Cation‐Pi interaction is shown as a green dashed line. G) Pull‐down assay demonstrates the protein interaction between GNE‐317 and the recombinant N‐terminal FERM domain of Moesin. Biotin‐GNE‐317 beads. Biotin‐GNE‐317 beads were constructed by conjugating biotinylated GNE‐317 to streptavidin‐coated beads. Free GNE‐317 refers to the addition of unbound GNE‐317 to recombinant of Moesin prior to pull‐down assays to neutralize binding. H) Hypothetical schematic diagram of Moesin activation under normal conditions and its inhibition by GNE‐317. I) Immunoprecipitation (IP) and immunoblot (IB) analyses of MSN polyubiquitination in GSC727‐1 overexpressing Flag‐tagged MSN, with or without GNE‐317 treatment. GSC727‐1 were then treated with 10 µM lactacystin (lacta) for 5h. Ub, ubiquitin. J) Immunoblot analysis of subtype marker genes in GSC727‐1 (Vector or MSN overexpression) treated with GNE‐317 (5 µm). K) Relative mRNA levels of DNA repair‐related genes in GSC727‐1 (Vector, MSN‐OE, MSN‐OE+GNE‐317 (5 µm)) with or without RT (6 Gy, 48 h) or TMZ (200 µm, 48 h) treatment. Data are shown as mean ± SEM. n = 3 independent experiments. * p < 0.05, ** p < 0.01, *** p < 0.001; two‐tailed unpaired t‐test. L) Representative images and M) quantification of γ‐H2AX staining on GSC727‐1 (vector, MSN‐OE, MSN‐OE+GNE‐317) with or without RT treatment (6 Gy, 48 h) or TMZ (200 µm, 48 h). Scale bars, 10 µm. Data are represented as means ± SEM. n = 5 independent experiments. *** p < 0.001, ns, p >0.05; two‐tailed unpaired t‐test. N) Immunoblot and O) quantification analysis of downstream PI3K/mTOR signaling pathway in GSC727‐1 (Vector or MSN overexpression) treated with GNE‐317 (5 µm). P) Immunoblot and Q) quantification analysis of downstream PI3K/mTOR signaling pathway in GSC924 transduced with shNT or shMSN. R) Immunoblot analysis of key MES transcriptional regulators and pathways in GSC727‐1 (vector control or MSN overexpression) treated with GNE‐317 (5 µm). S) Immunoblot analysis of subtype marker genes in GSC727‐1 cells (vector control or MSN overexpression) treated with the PI3K inhibitor (LY294002, 10µm), the mTOR inhibitor (Torin1, 10 nm), or GNE‐317 (5 µM). T) Relative mRNA levels of DNA repair‐related genes in GSC727‐1 (Vector, MSN‐OE, MSN‐OE+LY294002 (10µm), MSN‐OE+Torin1 (10 nm), MSN‐OE+GNE‐317 (5 µm)). Data are shown as mean ± SEM. n = 3 independent experiments. * p < 0.05, ** p < 0.01, *** p < 0.001; two‐tailed unpaired t‐test.
Figure 8
Figure 8
GNE‐317 can reduce resistance to RT or TMZ in GSCs. With the indicated concentrations of GEN‐317 and RT/TMZ for 48 h. A) Cell inhibition matrices (left), synergy scores (middle), and 3D ZIP model (right) were calculated using the ZIP model in GSC924. White boxes and black crosses mark the optimal combination. B) Cell viability assay of GSCs treated with different treatments (RT: 8 Gy, TMZ: 100 µM, GNE‐317: 1 µm). n = 6 biological independent samples. Data are shown as means ± SD. P values are in the table on the right, two‐way ANOVA analysis followed by Tukey's multiple test. C) A schematic of the experimental procedure for the GSC924 orthotopic xenograft model. Tumor‐bearing nude mice were treated with specified methods (DMSO (CON), RT, TMZ, GNE‐317, RT +TMZ, and RT +TMZ + GNE‐317) by gavage for 2 weeks, respectively. D) Representative images and E) quantification analysis of relative luciferase on days 10, 17, and 24 are shown. n = 5 for each group. Data are represented as means ± SEM. * p < 0.05, *** p < 0.001, ns, p > 0.05; one‐way ANOVA with Tukey's method for multiple comparisons. F) Kaplan–Meier survival curves of mice bearing GSC924‐derived xenografts treated with different treatments. *** p < 0.001, ns, p > 0.05; log‐rank test. n = 10 biological independent samples.

References

    1. Alexander B. M., Cloughesy T. F., Glioblastoma A., J. Clin. Oncol. 2017, 35, 2402. - PubMed
    1. Van Meir E. G., Hadjipanayis C. G., Norden A. D., Shu H.‐K., Wen P. Y., Olson J. J., CA Cancer J. Clin. 2010, 60, 166. - PMC - PubMed
    1. Stupp R., Hegi M. E., Mason W. P., van den Bent M. J., Taphoorn M. J. B., Janzer R. C., Ludwin S. K., Allgeier A., Fisher B., Belanger K., Hau P., Brandes A. A., Gijtenbeek J., Marosi C., Vecht C. J., Mokhtari K., Wesseling P., Villa S., Eisenhauer E., Gorlia T., Weller M., Lacombe D., Cairncross J. G., Mirimanoff R.‐O., Lancet Oncol. 2009, 10, 459. - PubMed
    1. Wen P. Y., Kesari S., N. Engl. J. Med. 2008, 359, 492. - PubMed
    1. Weller M., Cloughesy T., Perry J. R., Wick W., Neuro‐Oncol. 2013, 15, 4. - PMC - PubMed

MeSH terms

LinkOut - more resources