. 2025 Feb;16(1):e13675.
doi: 10.1002/jcsm.13675.

Circulating Extracellular Vesicles in Alcoholic Liver Disease Affect Skeletal Muscle Homeostasis and Differentiation

Affiliations

Circulating Extracellular Vesicles in Alcoholic Liver Disease Affect Skeletal Muscle Homeostasis and Differentiation

Laura Barberi et al. J Cachexia Sarcopenia Muscle. 2025 Feb.

Abstract

Background: The mechanisms underlying muscle alteration associated to alcoholic liver disease (ALD) are not fully understood and the physiopathologic mediators of the liver-muscle interplay remains elusive. We investigated the role of circulating extracellular vesicles (EVs) in ALD as potential mediators of muscle atrophy.

Methods: We established a mouse model of sarcopenia associated to ALD, by feeding mice with an alcoholic diet for 8 weeks. We investigated the effects of hepatic and circulating EVs isolated from these mice (EtOH mice; n = 7 females) on muscle cell cultures, comparing them with EVs from mice fed with a standard diet (CD mice; n = 6 females). Additionally, we examined the impact of circulating EVs from patients with alcohol-related cirrhosis (7 males and 2 females, mean age 55.4 years) on primary human muscle cells, comparing them with EVs from age-matched healthy subjects (6 males and 3 females). We analysed the miRNA profile of the EVs to identify potential mediators of ALD-associated sarcopenia.

Results: We demonstrated that circulating EVs were internalized by muscle cells and that EVs from ALD mice and cirrhotic patients caused alteration in the myogenic program. Molecular analysis revealed that serum EVs from ALD mice reduced protein synthesis in C2C12 cells, decreasing levels of p-AKT/AKT (-54.6%; p < 0.05), p-mTOR/mTOR (-54.5%; p < 0.05) and p-GSK3(Ser9)/GSK3 (-30.63%). Similarly, hepatic EVs induced defects in muscle differentiation, with reduced levels of p-AKT/AKT (-39.1%; p < 0.05), p-mTOR/mTOR (-30.1%; p < 0.05) and p-GSK3(Ser9)/GSK3 (-40%). C2C12 cells treated with either serum or hepatic EtOH-EVs exhibited upregulated expression of muscle-specific atrophy markers Atrogin-1 (+61.2% and +189.5%, respectively; p < 0.05) and MuRF1 (+260.4% and +112.5%, respectively; p < 0.05), along with an increased LC3-II/-I ratio (+131.5% and +40.2%, respectively; p < 0.05), indicating enhanced autophagy. MiRNA analysis revealed that both circulating and hepatic EVs from ALD mice showed elevated expression of miR-21, miR-155, miR-223 and miR-122 (+230% and +292%, respectively; p < 0.01) suggesting their potential role in sarcopenia. Human muscle cells exposed to EVs from cirrhotic patients exhibited reduced protein synthesis and upregulated Atrogin-1 (+113%; p < 0.05) and MuRF1 (+86.3%; p < 0.05), indicating proteasome activation. Circulating EVs of alcoholic patients showed upregulation of the same miRNAs observed in EtOH mice, including the liver-specific miR-122 (+260%; p < 0.05) suggesting, also in human liver disease, a hepatic origin of circulating EVs.

Conclusions: Our study highlights the critical role of ALD-derived circulating EVs in affecting muscle homeostasis and myogenic program, suggesting potential therapeutic targets for mitigating muscle loss in ALD.

Keywords: alcoholic liver disease (ALD); extracellular vesicles (EVs); liver‐muscle interplay; microRNA (miRNA); muscle atrophy; sarcopenia.


Conflict of interest statement

The authors declare no conflicts of interest.

Figures

FIGURE 1
FIGURE 1
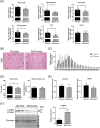
Hepatic steatosis and inflammatory activation in EtOH‐fed mice, compared to control diet (CD) mice. (A) Representative images of liver cross sections of CD mice and EtOH mice stained with haematoxylin and eosin (H&E) (upper panels; scale bar, 100 μm) and Oil red O (lower panels; scale bar, 20 μm) (n ≥ 3 per group). (B,C) Real‐time PCR analysis to evaluate mRNA expression levels of CCL‐2 (B, left panel), CXCL1 (B, right panel), TNF‐α (C, left panel) and PPAR‐γ (C, right panel) in liver tissue of CD and EtOH mice (n ≥ 6 per group). (D) Quantification of alanine aminotransferase (ALT) activity in serum samples of CD and EtOH mice (n ≥ 6 per group). (E,F) Representative images of immunofluorescence analysis of Ly6G (E, left panel) and F4/80 (F, left panel) positive cells (in green) in liver tissue of CD and EtOH mice (scale bar, 50 μm). Nuclei are stained with Hoechst (blue). Intensity of Ly6G and F4/80 fluorescent signals was quantified (mice per group = 4; image fields measured per mouse ≥ 3) (E,F, right panels, respectively). Nuclei are stained with Hoechst (blue). Data are expressed as mean ± SEM. Data were analysed by Mann–Whitney U test. EtOH mice versus CD mice, *p < 0.05. All data are represented as mean ± SEM. Data were analysed by Mann–Whitney U test. EtOH mice versus CD mice, *p < 0.05 and **p < 0.01.
FIGURE 2
FIGURE 2
Muscle atrophy in EtOH mice compared with CD mice. (A) Body weight (n ≥ 6 per group) and muscle mass of different skeletal muscles (n ≥ 12 per group) of CD and EtOH mice. Muscle weights (mg) were normalized to tibia length (mm). (B) Representative images of cross sections of extensor digitorum longus (EDL) muscle fibres from CD and EtOH mice stained with haematoxylin and eosin (H&E) (scale bar, 100 μm) (n ≥ 3 per group). (C) Frequency distribution of cross‐sectional area (CSA) of EDL muscle fibres (n ≥ 3 per group). (D) Tetanic force (left panel) and specific force (right panel) measurements of EDL muscle from CD and EtOH mice (n ≥ 6 per group). (E) Real‐time PCR analysis to evaluate Atrogin‐1 (left panel) and MuRF1 (right panel) mRNA expression levels in gastrocnemius muscle of CD and EtOH mice (n ≥ 6 per group). (F) Representative images (left panel) and densitometric analysis (right panel) of western blot for LC3B protein in gastrocnemius muscles of CD and EtOH mice. Densitometric analysis represents the cytosolic protein ratio between the isoforms LC3B‐II/LC3B‐I, indicating the autophagic flux (n ≥ 5 per group). Ponceau was used as a loading control. Full‐length western blot images are shown in Figure S1. All data are expressed as mean ± SEM. Data were analysed by Mann–Whitney U test. EtOH mice versus CD mice, *p < 0.05 and **p < 0.01.
FIGURE 3
FIGURE 3
Analysis of EVs isolated from serum of CD and EtOH mice. (A) Determination by Bradford assay of total protein content of EVs isolated from serum of CD and EtOH mice. EV protein amount (mg) is normalized to serum volume (mL) used for EV isolation (n ≥ 6 per group). (B) Representative images of western blot for CD9 and CD81 protein of EVs derived from equal serum amount of CD and EtOH mice (n ≥ 5 per group). Stain‐free was used as a loading control. Full‐length western blot images are shown in Figure S3. (C) Representative images of transmission electron microscopy (TEM) (upper panels; scale bar: 0.2 μm; black arrows: EVs < 50 nm; white arrows: EVs ≥ 50 nm) and scanning electron microscopy (SEM) (lower panels; scale bar: 1 μm; black arrows: EVs < 100 nm; white arrows: EVs ≥ 100 nm) analyses to test efficiency of EV purification from serum of CD and EtOH mice (n ≥ 3 per group). At a lower magnification respect to TEM images, SEM images showed wider frameworks of the EV populations revealing a wider range of vesicle dimensions and the EV spherical morphology. (D) Representative confocal microscopy images of C2C12 cell culture exposed for 3 h to PKH‐26+/SytoRNA+ EVs. Nuclei are stained in blue with Hoechst. SytoRNA positive cells are stained in green (scale bar: 10 μm). (E,F) Fluorescent intensity of PKH‐26 and SytoRNA signals in cell culture after 3 h of exposure to co‐labelled EVs (E, left and right panel, respectively); fluorescent intensity of PKH‐26 signals in cell culture after 24 h of exposure to PKH‐26‐EVs (F) (n ≥ 3 per group). All data are expressed as the mean ± SEM. Data are analysed by Mann–Whitney U test. EtOH‐EVs versus CD‐EVs, **p < 0.01.
FIGURE 4
FIGURE 4
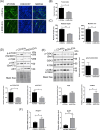
Exposure of C2C12 cell culture to EVs isolated from serum of CD and EtOH mice induced in vitro muscle atrophy. (A) Representative images of immunofluorescence analysis for myosin on C2C12 cell culture on the fifth day in differentiation (DM5) after exposure to serum EVs derived from CD (+CD‐EVs) and EtOH mice (+EtOH‐EVs); EV exposure was performed at time of differentiation (DM0) and after 3 days of differentiation (DM3). (B) Measurement of fusion index and (C) morphometric analysis of myotubes in EV‐treated C2C12 cell culture at DM5. Nuclei and myotubes were examined in five microscopic fields (scale bar: 100 μm) for each group in three independent cultures. (D) Representative images (top panel) and densitometric analysis (bottom panel) of western blot for p‐AKT (Ser473), total AKT, p‐mTOR (Ser2481) and total mTOR proteins in EV‐treated C2C12 cell culture at DM5. Densitometric analysis represents the protein ratio of p‐AKT/AKT and p‐mTOR/mTOR (n ≥ 5 for each group in three independent cultures). Full‐length western blot images are shown in Figure S6. (E) Representative images (top panel) and densitometric analysis (right and bottom panels) of western blot for p‐GSK3 (Ser9), total GSK3, ATG5 and LC3B proteins in EV‐treated C2C12 cell culture at DM5. Densitometric analysis represents the protein ratio of p‐GSK3/GSK3 and LC3B‐II/I, whereas ATG5 protein levels were measured normalizing western blot band intensity to stain‐free total lane protein (n ≥ 5 for each group in three independent cultures). Stain‐free was used as a loading control. Full‐length western blot images are shown in Figure S7. (F) Real‐time PCR analysis to evaluate Atrogin‐1 and MuRF1 mRNA expression levels in C2C12 cells after exposure to serum CD‐ and EtOH‐EVs at DM5. All data are expressed as mean ± SEM. Data are analysed by Mann–Whitney U test. C2C12 cell culture treated with EtOH‐EVs versus culture treated with CD‐EVs; *p < 0.05, ***p < 0.001.
FIGURE 5
FIGURE 5
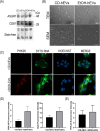
Analysis of hepatic EVs isolated from liver of CD and EtOH mice. (A) Representative images of western blot for ASGR1 and CD81 protein level of hEVs isolated from liver of CD and EtOH mice (n ≥ 3 per group). Stain‐free was used as a loading control. Full‐length western blot images are shown in Figure S8. (B) Representative images of transmission electron microscopy (TEM) (upper panels; scale bar: 200 nm; black arrows: EVs ≤ 50 nm; white arrows: EVs > 50 nm) and scanning electron microscopy (SEM) (scale bar: 1 μm; black arrows: EVs ≤ 100 nm; white arrows: EVs > 100 nm) analyses to test efficiency of hEV purification from liver tissue of CD and EtOH mice (n ≥ 3 per group). At a lower magnification respect to TEM images, SEM images showed wider frameworks of the EV populations and revealed the EV spherical morphology. (C) Representative confocal microscopy images of C2C12 cell culture exposed for 3 h to PKH‐26+/SytoRNA+‐labelled hepatic EVs. Nuclei are stained in blue with Hoechst. SytoRNA‐positive cells are stained in green (scale bar: 10 μm). (D,E) Fluorescent intensity of PKH‐26 and SytoRNA signals in cell culture after 3 h of exposure to hepatic co‐labelled EVs (E, left and right panel, respectively) (F) (n ≥ 3 per group). All data are expressed as the mean ± SEM (n ≥ 3). Data were analysed by Mann–Whitney U test. EtOH‐hEVs versus CD‐hEVs, *p < 0.05.
FIGURE 6
FIGURE 6
Exposure of C2C12 cell culture to hepatic EVs isolated from CD and EtOH mice induces in vitro muscle atrophy. (A) Representative images of immunofluorescence analysis for myosin on C2C12 cell culture after 5 days of differentiation (DM5) after exposure to hepatic EVs (hEVs) derived from CD mice (+CD‐hEVs) and EtOH mice (+EtOH‐hEVs); hEV exposure was performed at time of differentiation (DM0) and after 3 days of differentiation (DM3) (scale bar: 100 μm). (B) Measurement of Fusion index and (C) morphometric analysis of myotubes in hEV‐treated C2C12 cell culture at DM5. Nuclei and myotubes were examined in five microscopic fields for group in three independent cultures. (D) Real‐time PCR analysis to evaluate Atrogin‐1 (left panel) and MuRF1 (right panel) mRNA expression levels in C2C12 cells exposed to hepatic CD‐EVs and EtOH‐EVs at DM5. (E) Representative images (left panel) and densitometric analysis (right panel) of western blot for LC3B‐II and LC3B‐I proteins in hepatic EV‐treated C2C12 cell culture at DM5. Densitometric analysis represents the protein ratio of LC3B‐II/I (n ≥ 5 for each group in three independent cultures). Stain‐free was used as a loading control. Full‐length western blot images are shown in Figure S11. (F) Representative images (left panel) and densitometric analysis (right panels) of western blot for pmTOR (Ser2481), total mTOR, p‐AKT (Ser473), total AKT, p‐GSK3 (Ser9), total GSK3 and ATG5 proteins in hEV‐treated C2C12 cell culture at DM5. Densitometric analysis represents the protein ratio of p‐mTOR/mTOR, p‐AKT/AKT and p‐GSK3/GSK3; ATG5 protein levels were measured normalizing western blot band intensity to stain‐free total lane protein (n ≥ 5 for each group in three independent cultures). Stain‐free was used as a loading control. Full‐length western blot images are shown in Figure S12. All data are expressed as mean ± SEM. Data are analysed by Mann–Whitney U test. C2C12 cell culture treated with EtOH‐hEVs versus culture treated with CD‐hEVs, *p < 0.05, **p < 0.01, ***p < 0.001.
FIGURE 7
FIGURE 7
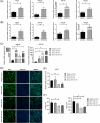
Similar expression pattern of miRNAs between circulating, hepatic EVs and skeletal muscle tissue.(A‐B) Real‐time PCR analysis to evaluate miR‐21, miR‐122, miR‐155 and miR‐223 expression levels in EVs isolated from serum (A) and liver tissue (B) of CD and EtOH mice (n ≥ 5). All data are expressed as the mean ± SEM. Data were analysed by Mann–Whitney U test. EtOH‐EVs versus CD‐EVs, EtOH‐hEVs versus CD‐hEVs EtOH mice versus CD mice, *p < 0.05, **p < 0.01. (C) Real‐time PCR analysis to evaluate miR‐122 (left panel) and miR‐155 (right panel) expression levels in C2C12 cells 72 h after mimic administration (n ≥ 3). (D) Representative confocal microscopy images of C2C12 cell culture immunostained with MF20 after 72 h of exposure to miR‐112 or miR‐155 mimics or both. Mimics transfection was performed at the time of the shift in differentiation medium (DM0). Nuclei and myotubes were examined in five microscopic fields for each group in three independent cultures. (E) Morphometric analysis of myotubes in C2C12 cells after 72 h of miRNA mimics transfection. (E) Real‐time PCR analysis to evaluate Myh7 expression levels after 72 h of miRNA mimics transfection (n ≥ 3). All data are expressed as the mean ± SEM. Data were analysed by one‐way ANOVA. Mimic versus negative control, *p < 0.05.
FIGURE 8
FIGURE 8
Analysis of EVs isolated from serum samples of healthy individuals (H‐EVs) and cirrhotic patients (CLD‐EVs) and evaluation of their effects on muscle cells. (A) Determination by Bradford assay of total protein content of EVs isolated from serum of healthy donors and CLD patients (A, left panel). EV protein amount (mg) is normalized to serum volume (mL) used for EV isolation (n ≥ 7 per group). Representative images of western blot for Alix and CD63 protein of EVs derived from equal serum amount of healthy donors and CLD patients (n ≥ 4 per group) (A, right panel). (B) Representative images of transmission electron microscopy (TEM) (upper panels; scale bar: 0.5 μm; black arrows: EVs ≤ 50 nm; white arrows: EVs > 50 nm) and scanning electron microscopy (SEM) (lower panels; scale bar: 1 μm; black arrows: EVs < 100 nm; white arrows: EVs ≥ 100 nm) analyses to test efficiency of EV purification from serum of healthy donors and CLD patients (n ≥ 3 per group). At a lower magnification respect to TEM images, SEM images showed wider frameworks of the EV populations and revealed the EV spherical morphology. (C) Representative images of immunofluorescence analysis for myosin on primary culture of human skeletal muscle cells on the fifth day in differentiation medium (DM5) after exposure to EVs derived from serum of H and CLD patients (C, left panel) (scale bar: 100 μm). EV exposure was performed at time of differentiation (DM0) and after 3 days of differentiation (DM3). Measurement of fusion index of myotubes in EV‐treated human skeletal muscle cells at DM5 (C, right panel). (D) Morphometric analysis of myotubes in EV‐treated human skeletal muscle cells at DM5. Nuclei and myotubes were examined in five microscopic fields for each group in three independent cultures. (E) Real‐time PCR analysis to evaluate Atrogin‐1 (left panel) and MuRF1 (right panel) mRNA expression levels in human primary skeletal muscle cells after exposure to HD‐ and CLD‐EVs at DM5. (F) Real‐time PCR analysis to evaluate miR‐21, miR‐122, miR‐155 and miR‐223 expression levels in EVs isolated from serum CLD and healthy individuals (n ≥ 5 per group). All data are expressed as mean ± SEM. Statistical analysis: non‐parametric test, Mann Whitney U test, *p < 0.05 and **p < 0.01; * represents the significance with the healthy subjects.

References

    1. Dasarathy S. and Merli M., “Sarcopenia From Mechanism to Diagnosis and Treatment in Liver Disease,” Journal of Hepatology 65 (2016): 1232–1244. - PMC - PubMed
    1. Merli M., Berzigotti A., Zelber‐Sagi S., et al., “EASL Clinical Practice Guidelines on Nutrition in Chronic Liver Disease,” Journal of Hepatology 70 (2019): 172–193. - PMC - PubMed
    1. Dasarathy J., McCullough A. J., and Dasarathy S., “Sarcopenia in Alcoholic Liver Disease: Clinical and Molecular Advances,” Alcoholism, Clinical and Experimental Research 41 (2017): 1419–1431. - PMC - PubMed
    1. Di Cola S., Nardelli S., Ridola L., Gioia S., Riggio O., and Merli M., “Ammonia and the Muscle: An Emerging Point of View on Hepatic Encephalopathy,” Journal of Clinical Medicine 11 (2022): 611. - PMC - PubMed
    1. Levitt D. E., Luk H. Y., and Vingren J. L., “Alcohol, Resistance Exercise, and mTOR Pathway Signaling: An Evidence‐Based Narrative Review,” Biomolecules 13, no. 1 (2022): 2. - PMC - PubMed