Randomized Controlled Trial
. 2025 Feb;35(2):e70024.
doi: 10.1111/sms.70024.

Cardiorespiratory Fitness Improvements Following Low-Frequency Training Are Not Inferior to High-Frequency Training Matched for Intensity and Volume

Affiliations
Randomized Controlled Trial

Cardiorespiratory Fitness Improvements Following Low-Frequency Training Are Not Inferior to High-Frequency Training Matched for Intensity and Volume

Thomas R Tripp et al. Scand J Med Sci Sports. 2025 Feb.

Abstract

Epidemiological evidence suggests low-frequency physical activity provides health benefits, but the physiological impacts of weekly training frequency are understudied. We investigated whether "Weekend Warrior" (WW) training was inferior to traditional, high-frequency (HF) training for improving maximal oxygen uptake (V̇O2max). The secondary aim was to assess integrative physiological adaptations to each protocol. Twenty-eight sedentary-to-recreationally-active adults aged 18-45 years (14 males and 14 females) were randomized to perform 8-weeks of HF or WW training on a cycle ergometer (either four or two sessions weekly, respectively), consisting of continuous and interval exercise, with intensity and volume matched between groups. WW training was not inferior to HF training for improving V̇O2max (mean ± standard deviation; WW: 43.5 ± 6.5 vs. 47.8 ± 6.4 mL/kg/min; HF: 42.3 ± 6.2 vs. 47.3 ± 6.7; main effect of training, p < 0.001). Severe domain cycling time-to-task-failure also increased in both groups (WW: 3.7 ± 1.6 vs. 8.6 ± 3.2 min; HF: 3.5 ± 0.9 vs. 7.7 ± 2.8; main effect of training: p < 0.001). Frequency did not affect improvements in hemoglobin mass (WW: 771 ± 203 vs. 790 ± 189 g; HF: 754 ± 185 vs. 765 ± 202; main effect of training: p = 0.043) or skeletal muscle oxidative capacity (WW: 0.034 ± 0.008 vs. 0.045 ± 0.015 s-1; HF: 0.036 ± 0.011 vs. 0.041 ± 0.010; main effect of training: p = 0.002), nor did it influence improvements in cardiorespiratory, substrate oxidation, voluntary muscle contractile, and perceptual responses to submaximal exercise (interaction effect: p > 0.05 for all outcomes). Eight weeks of training improved V̇O2max and a wide range of physiological outcomes with no difference between training frequencies, suggesting that the distribution of weekly exercise volume has a limited effect during short-term training. Trial Registration: This trial was registered at ClinicalTrials.gov identifier: NCT05908578.

Keywords: V̇O2max; Weekend Warrior; exercise performance; exercise thresholds; fatigue; hemoglobin mass; muscle oxidative capacity; neuromuscular function.


Conflict of interest statement

The authors declare no conflicts of interest.

Figures
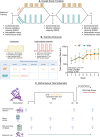
FIGURE 1
FIGURE 1
A schematic of the experimental overview. The overall study consisted of baseline testing, followed by random allocation to either the high‐frequency (HF) or low‐frequency (Weekend Warrior, WW) training protocols. Following week 4, participants completed partial testing, and following week 8, participants repeated the full testing protocol (A). Both training protocols consisted of continuous and high‐intensity interval training sessions performed on a cycle ergometer. The HF group completed four workouts spread throughout each training week. The WW group completed two workouts on back‐to‐back days, performing each set of two training units as one prolonged bout on each training day. Total completed work was very similar between groups throughout the protocol (B). During the performance trial (C) participants cycled in the heavy domain for 30 min, at a power output 70% of the way between the gas exchange threshold (GET) and respiratory compensation point (RCP) power outputs. After a 2 min break for neuromuscular function assessment, participants completed a time‐to‐task failure (TTF) bout in the severe domain (85% of peak power output). Neuromuscular function was measured using the interpolated twitch technique and isometric maximal voluntary contractions of the knee extensors (pre‐exercise, post‐heavy exercise, post‐TTF). Blood lactate, rating of perceived exertion (RPE) and rating of fatigue were measured (during 50 W warm‐up, at 10 and 30 min of the heavy trial, and post‐TTF). Gas exchange and heart rate were measured throughout the trial.
FIGURE 2
FIGURE 2
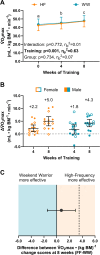
Relative V̇O2max (per total body mass) in response to high‐frequency (HF) and Weekend Warrior (WW) exercise training. The mean (± standard deviation) V̇O2max (A) across the training period and the individual change scores for V̇O2max (mean and 95% confidence interval) from baseline to the respective time point (B) are shown for each group, with the mean change at week 8 presented numerically. An estimation plot, showing the point estimate and 95% confidence interval, is presented for the difference in training‐induced V̇O2max change scores between the two groups, with the dashed line representing the a priori specified non‐inferiority margin of 3.5 mL/kg/min (C). Data in Panel A were analyzed with a two‐way ANOVA, with the p‐value for each effect shown. Significant effects (bolded) were followed up with post hoc tests as appropriate. Time points with different letters indicate statistically significant differences for the main effect of training (p < 0.05). n = 14 (HF) and n = 14 (WW) for all panels.
FIGURE 3
FIGURE 3
Respiratory compensation point (RCP), gas exchange threshold (GET), hemoglobin mass (Hbmass) and near‐infrared spectroscopy (NIRS)‐derived muscle oxidative capacity (k) in response to high‐frequency (HF) and Weekend Warrior (WW) exercise training. The group mean (± standard deviation) across the training period (A, C, E, G) and the individual change scores (mean and 95% confidence interval) from baseline to the respective time point (B, D, F, H) are shown for RCP (A, B), GET (C, D), Hbmass (E, F), and muscle oxidative capacity (G, H). Data were analyzed with two‐way ANOVAs, with the p‐value for each effect shown. Significant effects (bolded) were followed up with post hoc tests as appropriate. Time points with different letters indicate statistically significant differences for the main effect of training (p < 0.05). FFM, fat‐free mass. n = 14 (HF) and n = 14 (WW) for RCP and GET. n = 14 (HF) and n = 13 (WW) for Hbmass. n = 13 (HF) and n = 12 (WW) for k.
FIGURE 4
FIGURE 4
Severe intensity time to task failure (TTF) and neuromuscular function in response to high‐frequency (HF) and Weekend Warrior (WW) exercise training. The mean (± standard deviation) TTF at baseline and after 8 weeks of training at the same absolute (Abs) and relative (Rel) intensities (A) and the individual change scores (with mean and 95% confidence interval, B) are shown. Data were analyzed with a two‐way repeated measures ANOVA. Statistically significant effects (bolded) were followed up with post hoc tests. Trials with different letters were significantly different for one another for the main effect of training. Muscle contractile responses and voluntary contractile properties at baseline (0 min) and in response to 30 min of heavy exercise (35 min) and the TTF trial (final data points, time value varies) are shown at 0 weeks (HF 0 wk and WW 0 wk) and following 8 weeks of training (HF 8 wk and WW 8 wk) for the same absolute intensity trial. Overall voluntary muscle function was assessed using maximal voluntary contraction force (MVC; C). Decrements in peripheral components of muscle contractile function were assessed using potentiated twitch force (D) and the ratio of 10–100 Hz stimulation forces (Db10:100; F) and central adjustments assessed using voluntary activation (E) are plotted separately, with statistical analysis presented in Table 4. n = 14 (HF) and n = 14 (WW) for TTF. n = 13 (HF) and n = 14 (WW) for MVC, potentiated twitch, Db10:100, and voluntary activation.

References

    1. Reilly T., Morris T., and Whyte G., “The Specificity of Training Prescription and Physiological Assessment: A Review,” Journal of Sports Sciences 27, no. 6 (2009): 575–589, 10.1080/02640410902729741. - DOI - PubMed
    1. Egan B. and Sharples A. P., “Signal Transduction and Exercise,” in Molecular Exercise Physiology (Routledge, 2022), 152–189, 10.4324/9781315110752-7. - DOI
    1. Granata C., Jamnick N. A., and Bishop D. J., “Principles of Exercise Prescription, and How They Influence Exercise‐Induced Changes of Transcription Factors and Other Regulators of Mitochondrial Biogenesis,” Sports Medicine 48, no. 7 (2018): 1541–1559, 10.1007/s40279-018-0894-4. - DOI - PubMed
    1. MacInnis M. J. and Gibala M. J., “Physiological Adaptations to Interval Training and the Role of Exercise Intensity,” Journal of Physiology 595, no. 9 (2017): 2915–2930, 10.1113/JP273196. - DOI - PMC - PubMed
    1. Montero D. and Lundby C., “Refuting the Myth of Non‐Response to Exercise Training: ‘Non‐Responders’ Do Respond to Higher Dose of Training,” Journal of Physiology 595, no. 11 (2017): 3377–3387, 10.1113/JP273480. - DOI - PMC - PubMed

Publication types

Associated data