. 2025 May;12(17):e2408888.
doi: 10.1002/advs.202408888. Epub 2025 Feb 8.

Transcriptomic Profiling Unveils EDN3+ Meningeal Fibroblasts as Key Players in Sturge-Weber Syndrome Pathogenesis

Affiliations

Transcriptomic Profiling Unveils EDN3+ Meningeal Fibroblasts as Key Players in Sturge-Weber Syndrome Pathogenesis

Daosheng Ai et al. Adv Sci (Weinh). 2025 May.

Abstract

Sturge-Weber syndrome (SWS) is characterized by leptomeningeal vascular malformation, resulting in significant risks of life-threatening seizures and strokes. The current absence of specific treatments underscores the need to define the molecular and cellular mechanisms that drive the progression of SWS. Here, the transcriptome of 119 446 cells isolated from both malformed tissues and peri-lesion tissues from the brains of patients with SWS is examined. This comprehensive analysis finds a complex landscape of cell heterogeneity and distinct cell substate associated with the evolution of this disease are revealed. Notably, a unique fibroblast cluster and molecular mechanism are identified that contribute to the development of SWS. These findings not only expand the understanding of SWS but also open up promising avenues for therapeutic interventions.

Keywords: Sturge‐Weber syndrome; cerebrovasculature; meningeal fibroblasts; single‐cell RNA sequencing.


Conflict of interest statement

The authors declare no conflict of interest.

Figures
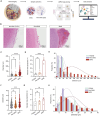
Figure 1
Figure 1
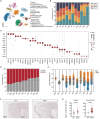
Collection of SWS lesions and peri‐lesion brain tissue from SWS patients. A) Schematic representation of specimen isolation and single‐cell RNA sequencing (scRNA‐seq) processing. B) Hematoxylin and eosin (HE) staining of meningeal and cortical tissue from non‐SWS (FCD II), peri‐SWS, and SWS samples. The SWS sample shows malformed meningeal vessels. Scale bar: 200 µm. C) Comparison of leptomeningeal vascular diameter among SWS lesion areas, peri‐SWS areas, and FCD II lesion areas (non‐SWS). **** p < 0.0001, ordinary one‐way ANOVA. Error bars indicate SEM. D) Comparison of leptomeningeal vascular density (area proportion) among SWS lesion areas, peri‐SWS areas, and FCD II lesion areas (non‐SWS). **** p < 0.0001, ordinary one‐way ANOVA. All error bars indicate SEM. E) Comparison of leptomeningeal vascular diameter distribution among SWS lesion areas, peri‐SWS areas, and FCD II lesion areas (non‐SWS). F) Comparison of layer 1–2 vascular diameter among SWS lesion areas, peri‐SWS areas, and FCD II lesion areas (non‐SWS). **** p < 0.0001, ordinary one‐way ANOVA. Error bars indicate SEM. G) Comparison of layer 1–2 vascular density (area proportion) among SWS lesion areas, peri‐SWS areas, and FCD II lesion areas (non‐SWS). **** p < 0.0001, ordinary one‐way ANOVA. Error bars indicate SEM. H) Comparison of layer 1–2 vascular diameter distribution among SWS lesion areas, peri‐SWS areas, and FCD II lesion areas (non‐SWS).
Figure 2
Figure 2
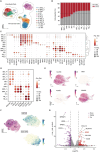
Identification of cell types within SWS lesions and peri‐lesion brain tissue from SWS patients. A) UMAP visualization showing 11 major cell types among the 11 SWS lesion and peri‐lesion samples from four SWS patients. Cell type abbreviations are defined in the key. B) The proportion of the 11 cell types derived from each patient based on their SWS and Ctrl samples. C) The top several gene markers for each major cell type. The size of each circle represents the percentage of cells expressing the target gene, and the color represents the average expression of the target gene. D) The proportion of each cell type isolated from SWS and control samples (SWS and Ctrl). Abbreviations: NT, neutrophil; SMC, smooth muscle cell; NEU, neuron; MP, macrophage; T Cell, CD8+ T cell; MG, microglial cell; OL, oligodendrocyte; AST, astrocyte; EC, endothelial cell; OPC, oligodendrocyte precursor cell; PFB, perivascular fibroblast. E) Jitter plot showing the likelihood of SWS associated with each cell type. The orange values represent the average likelihood of the cell being isolated from SWS samples, and the blue values represent the average likelihood of the cell being isolated from control samples. F) Immunostaining results show the expression of α‐SMA (labeling smooth muscle cells) in SWS and control (peri‐lesion) tissue. Slice thickness, 10 µm. Insets show the representative regions from the lesion and control group. G) Quantification of the diameter of αSMA+ blood vessels in SWS lesion and peri‐lesion tissues. ****p < 0.0001; two‐tailed unpaired t‐test. All error bars indicate SEM.
Figure 3
Figure 3
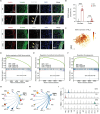
Cellular states of vascular cells during SWS progression. A) UMAP visualization depicting subpopulations of perivascular cells and endothelial cells. Abbreviations: SMC, smooth muscle cell; FMC, fibromyocyte; PC, pericyte; FB, fibroblast; cEC, capillary endothelial cell; aEC, arterial endothelial cell; vEC, venous endothelial cell. B) The proportion of vascular cell subtypes isolated from SWS and Ctrl (peri‐lesion) samples. C) The top several markers for each cell subpopulation in vascular cells. The size of the dot represents the percentage of cells expressing the marker gene, and the color represents the average expression of the marker gene. D) Dot plot presenting expression data for the classical markers of endothelial cells (PECAM1 and TIE1), smooth muscle cells (TAGLN, MYH11, and ACTA2), pericytes (PDGFRB), fibromyocyte (CCL19), and fibroblasts (COL1A1 and COL1A2) among each cell subpopulation in vascular cells. The size of the dot represents the percentage of cells expressing the marker gene, and the color represents the average expression of the marker gene. E) UMAP visualization depicting the expression of CLDN5 (pan‐endothelial cell marker), BMX (arterial endothelial marker), ACKR1 (venous endothelial marker), and SRARP (capillary endothelial marker). Darker colors mean the higher expression. F) UMAP visualization illustrating the cell states of perivascular fibroblasts (FB_1 and FB_2) and the expression of ABCA8 and SLC13A3. Darker colors mean the higher expression. G) Volcano plot presenting the differentially expressed genes in FB_2 of SWS compared to the control group. Significance cutoff: |Log2(Fold change)| ≥ 1 and adj. p‐value ≤ 0.05. Upregulated genes highlighted: CXCL12, ALDH1A1, EDN3, COL15A1, and VCAN; downregulated genes highlighted: EFEMP1, LMNA, SPSB1, and COCH.
Figure 4
Figure 4
The alteration of EDN3⁺ meningeal perivascular fibroblasts during SWS disease progression. A) Immunostaining showing the expression of SLC13A3 and EDN3 in pial matter and layer 1 of the cerebral cortex from peri‐lesion (Ctrl) and SWS tissue. Laminin (red), vimentin (green), and EDN3/SLC13A3 (gray). Nuclei are stained with DAPI. The dashed lines indicate pial surface. Slice thickness, 50 µm. Scale bar, 50 µm. B) Quantification of EDN3+ fibroblasts in SWS and peri‐lesion tissue in different brain regions. ****p < 0.0001; N.S., not significant. Two‐tailed unpaired t‐test. Error bars indicate SEM. C) UMAP visualization depicting the expression of EDN3 in FB_2. Darker colors mean the higher expression. D) Gene set enrichment analysis (GSEA) indicating the enrichment of positive regulation of MAP kinase activity in EDN3 + cells from FB_2. E) Gene set enrichment analysis (GSEA) indicating the enrichment of Regulation of endothelial cell proliferation in EDN3 + cells from FB_2. F) Gene set enrichment analysis (GSEA) indicating the enrichment of regulation of angiogenesis in EDN3 + cells from FB_2. G) Circle plot presenting the signaling strength sent from EDN3 cells from FB_2 to other vascular‐related subclusters. The width of the edge is proportional to communication strength. H) Circle plot presenting the signaling strength sent from EDN3 + cells from FB_2 to other vascular‐related subclusters. The width of the edge is proportional to communication strength. I) Violin plot presenting the expression level of WNT5A and FZD3 (the ligand and receptor of ncWNT pathway) in each subgroup of SWS and Ctrl. The FB_2 in Ctrl is the EDN3 cells from FB_2, while FB_2 in SWS is the EDN3 + cells.

References

    1. Zhao Z., Nelson A. R., Betsholtz C., Zlokovic B. V., Cell 2015, 163, 1064. - PMC - PubMed
    1. Andreone B. J., Lacoste B., Gu C., Annu. Rev. Neurosci. 2015, 38, 25. - PMC - PubMed
    1. Rustenhoven J., Tanumihardja C., Kipnis J., Circ. Res. 2021, 129, 174. - PubMed
    1. Storkebaum E., Quaegebeur A., Vikkula M., Carmeliet P., Nat. Neurosci. 2011, 14, 1390. - PubMed
    1. Yeom S., Comi A. M., Stroke 2022, 53, 3769. - PMC - PubMed

LinkOut - more resources