. 2025 Feb 8;82(1):73.
doi: 10.1007/s00018-025-05600-4.

Ketogenic diet induces an inflammatory reactive astrocytes phenotype reducing glioma growth

Affiliations

Ketogenic diet induces an inflammatory reactive astrocytes phenotype reducing glioma growth

Maria Rosito et al. Cell Mol Life Sci. .

Abstract

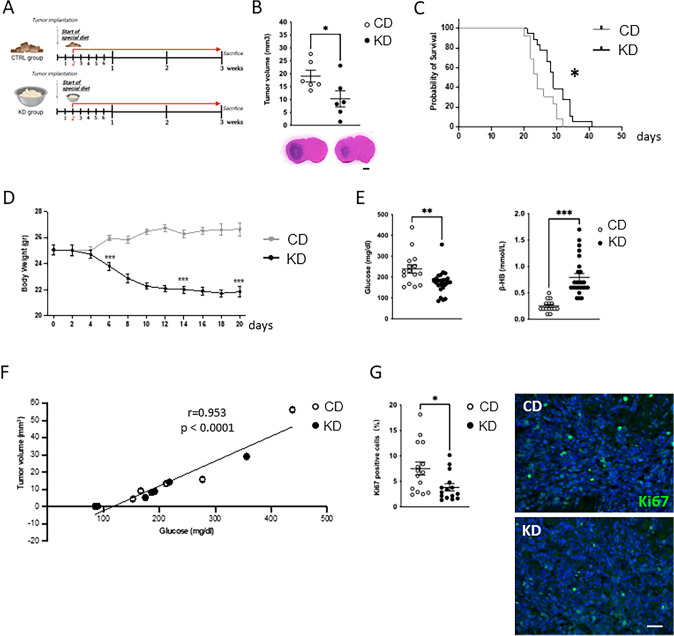
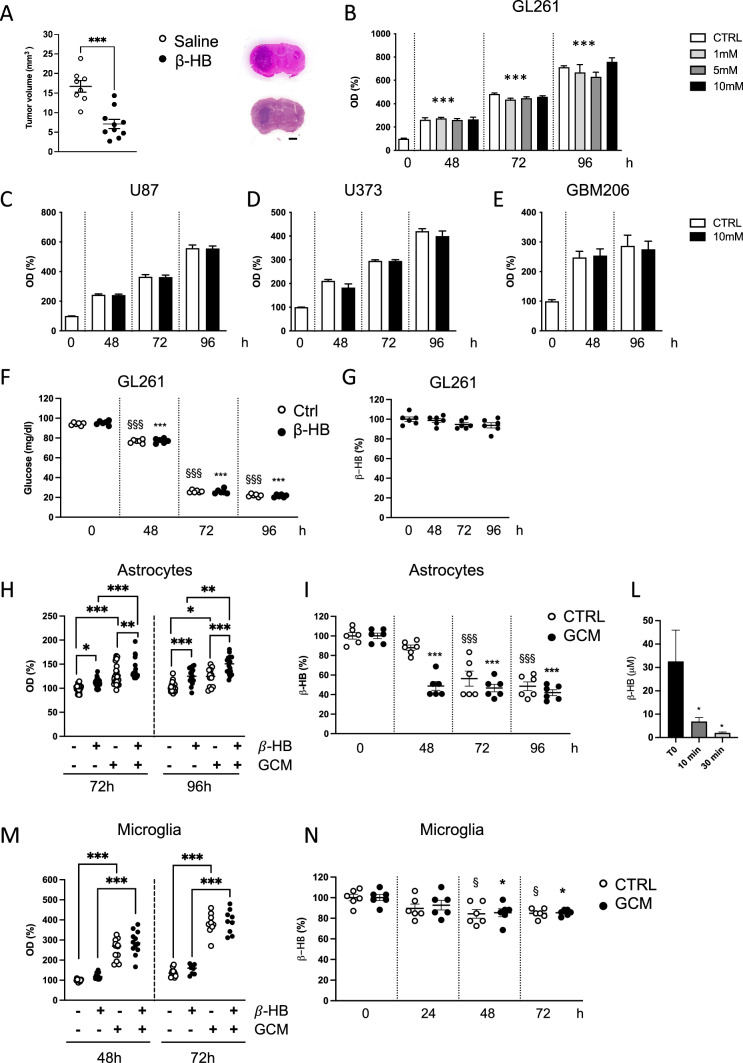
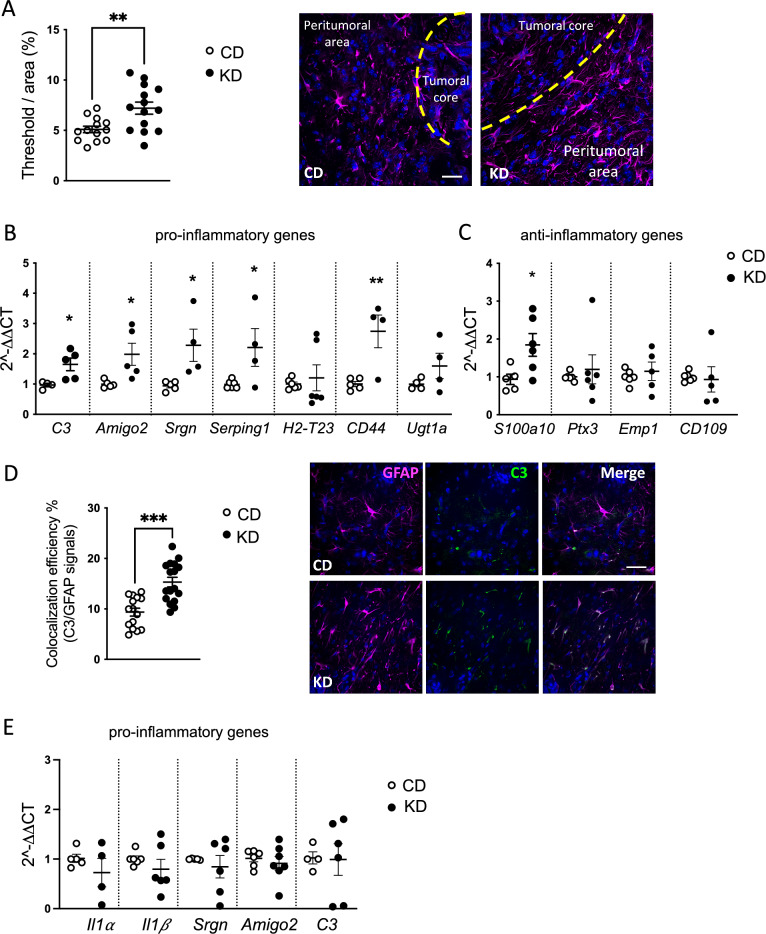
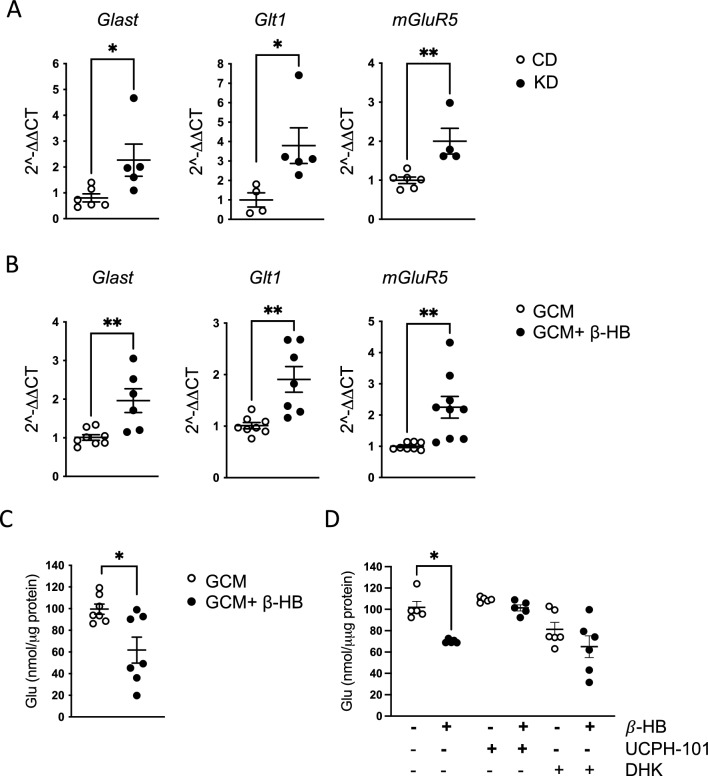
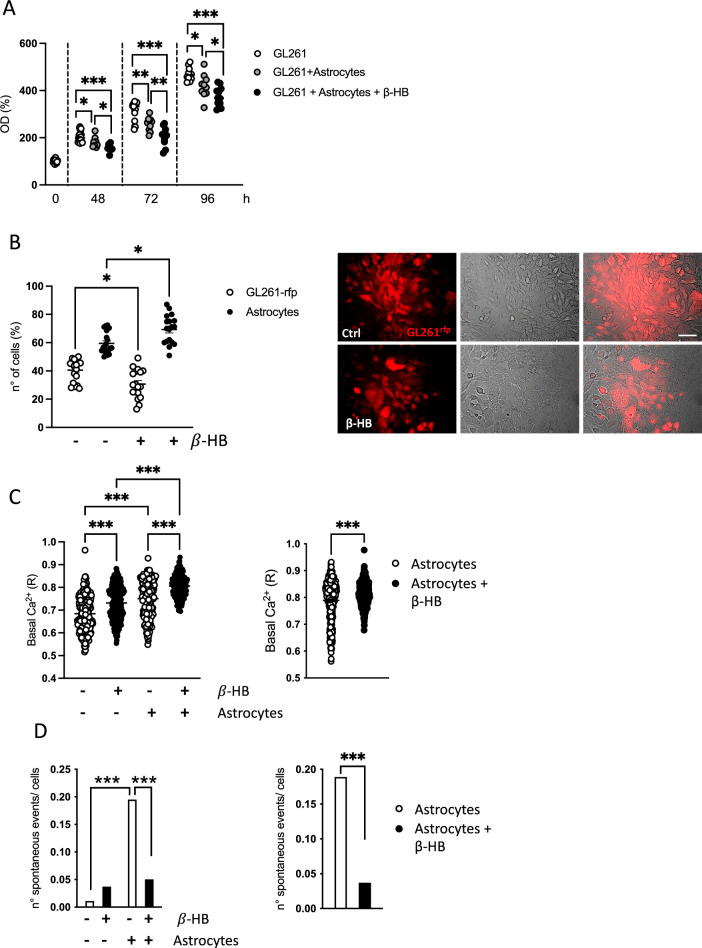
The use of a ketogenic diet (KD) in glioma is currently tested as an adjuvant treatment in standard chemotherapy regimens. The metabolic shift induced by the KD leads to the generation of ketone bodies that can influence glioma cells and the surrounding microenvironment, but the mechanisms have not yet been fully elucidated. Here, we investigated the potential involvement of glial cells as mediators of the KD-induced effects on tumor growth and survival rate in glioma-bearing mice. Specifically, we describe that exposing glioma-bearing mice to a KD or to β-hydroxybutyrate (β-HB), one of the main KD metabolic products, reduced glioma growth in vivo, induced a pro-inflammatory phenotype in astrocytes and increased functional glutamate transporters. Moreover, we described increased intracellular basal Ca2+ levels in GL261 glioma cells treated with β-HB or co-cultured with astrocytes. These data suggest that pro-inflammatory astrocytes triggered by β-HB can be beneficial in counteracting glioma proliferation and neuronal excitotoxicity, thus protecting brain parenchyma.

Keywords: Astrocytes; Astrogliosis; Glioma; Ketogenic diet; Microglia; Pro-inflammatory astrocytes; β-HB.


Conflict of interest statement

Declaration. Conflict of interests: All the authors declare no competing interests. Ethical approval: Experiments with mice were approved by the local animal welfare body and by the Italian Ministry of Health (authorization No. 231/2015PR) following the EC Directive 2010/63/EU and the Italian d.lgs.26/2014.

Figures

Fig. 1
Fig. 1
Effect of the KD on tumor growth and mice survival. A Study design. B Tumor size in CD and KD mice, n = 6, pooled from two experiments, three animals per group. Data are presented as the mean ± SEM *p < 0.05, Student’s t-test. Right pictures: Representative images of brain coronal slices, scale bar = 1 mm. C Kaplan–Meier survival curves of CD and KD GL261 bearing mice, *p = 0.012, Log-rank test. D Body weight measurements of CD and KD GL261 bearing mice. Data are presented as the mean ± SEM ***p < 0.001 Student’s t-test evaluated on days 6, 14, and 20. E Dot plot showing the blood glucose and β-HB level of CD and KD mice measured at day 14 after tumor injection. Data are presented as the mean ± SEM **p < 0.005, ***p < 0.001 Student’s t-test. F Dot plot showing the correlation between glucose levels and tumor volume in CD (n = 5) and KD (n = 7) mice. r = 0.953; p < 0.0001. G Dot plot showing the percentage of Ki67 positive cells in the tumor core area (CD: 15/3 slices/mice; KD: 15/3 slices/mice) Data are presented as the mean ± SEM *p < 0.05, Student’s t-test. (Left) Representative images of Ki67 (green) in CD and KD tumor core area. Hoechst staining (blu) for nuclei visualization; scale bar: 50 μm
Fig. 2
Fig. 2
Effect of β-HB treatment on GL261 and astrocytes. A Tumor size in saline and β-HB injected mice, n = 8–10 animals per group. Data are presented as the mean ± SEM ***p < 0.001, Student’s t-test. Right pictures: Representative images of brain coronal slices, scale bar = 1 mm. B Bar plot showing the MTT assay on GL261 cells stimulated with different β-HB concentrations. Data are presented as the mean ± SEM *** p < 0.001. One-way ANOVA—Dunnett’s multiple comparison test versus time 0. C Bar plot showing the MTT assay on human glioma cells U87, on D U373 and E GBM206 primary cells from patient. Data are presented as the mean ± SEM §§§ p < 0.001;*** p < 0.001. One-way ANOVA—Dunnett’s multiple comparison test versus its respective time 0. F Glucose consumption by GL261 cells without (white dots) or in the presence of β-HB (black dots). Data are presented as the mean ± SEM *** p < 0.001. One-way ANOVA—Dunnett’s multiple comparison test. G β-HB consumption by GL261 cells. Data are presented as the mean ± SEM. H MTT assay on astrocytes cultured with or without GCM and β-HB for 72 and 96 h of treatments. Data are presented as the mean ± SEM * p < 0.05 ** p < 0.005 *** p < 0.001 Two-way ANOVA. Fisher’s LSD test. I β-HB consumption by astrocytes: measurement of the normal extracellular medium (CTRL, white dots) or in the presence of GCM (black dots). Data are presented as the mean ± SEM §§§ p < 0.001; *** p < 0.001. One-way ANOVA—Dunnett’s multiple comparison test versus its respective time 0. L Intracellular β-HB consumption by astrocytes measured at the indicated time point. Data are presented as the mean ± SEM * p < 0.05. One-way ANOVA—Dunnett’s multiple comparison test. M MTT assay on microglia cultured with or without GCM and β-HB for 48 and 72 h of treatments. Data are presented as the mean ± SEM *** p < 0.001 Two-way ANOVA. Fisher’s LSD test. N β-HB consumption by microglia without (CTRL, white dots) or in the presence of GCM (black dots). Data are presented as the mean ± SEM. § p < 0.05; * p < 0.05. One-way ANOVA—Dunnett’s multiple comparison test versus its respective time 0
Fig. 3
Fig. 3
Astrocytes phenotyping upon KD and β-HB administration. A Scatter dot plots showing quantification of GFAP+ signal expressed as the percentual area occupied by fluorescent staining in CD (n = 13/3 slices/mice) and KD (n = 14/3 slices/mice) mice. Data are presented as the mean ± SEM **p < 0.005, Student’s t-test. Left: Representative z-projection confocal images of GFAP (magenta) in CD and KD tumoral and peritumoral area. Hoechst staining (blu) for nuclei visualization Scale bar: 50 μm. B RT-qPCR from ACSA+ cells isolated from CD and KD tumoral hemisphere reveals expression of pro-inflammatory genes and (C) anti-inflammatory genes. Gene expression is normalized to the housekeeping gene Gapdh. Data are presented as the mean ± SEM n = 4 to 6 mice pulled from two independent experiments. ** p < 0.01; *p < 0.05, Student’s t-test. D Scatter dot plots showing the percentual area of GFAP signal colocalizing with C3 staining (Ctrl n = 15/3 slices/mice; KD n = 17/3 slices/mice) Data are presented as the mean ± SEM *** p < 0.001, Student’s t-test. Left: Representative z-projection confocal images of GFAP (magenta) and C3 (green) colocalization in CD and KD peritumor area. Hoechst staining (blu) for nuclei visualization Scale bar: 50 μm. E RT-qPCR from Luc+-GL261 cells isolated from CD and KD tumoral hemisphere reveals the gene expression level of pro-inflammatory genes. Gene expression is normalized to the housekeeping gene Gapdh. Data are presented as the mean ± SEM n = 4 to 6 mice
Fig. 4
Fig. 4
Astrocytic expression of glutamate transporters and glutamate concentration. A RT-qPCR from ACSA+ cells isolated from CD and KD tumoral hemisphere reveals expression of glutamate transporters Glast, Glt1, and mGluR5 genes. Gene expression is normalized to the housekeeping gene Gapdh. Data are presented as the mean ± SEM n = 4 to 6 mice pulled from two independent experiments. ** p < 0.01; *p < 0.05, Student’s t-test. B RT-qPCR from astrocytes cultured in GCM with or without β-HB administration showing the relative expression of glutamate transporters Glast, Glt1, and mGluR5 genes. Gene expression is normalized to the housekeeping gene Gapdh. Data are presented as the mean ± SEM n = 6 to 9 samples pulled from 3 independent experiments. ** p < 0.01 Student’s t-test. C Scatter dot plot showing the glutamate quantification in astrocytes cultured in GCM with or without β-HB. Data (nmol/mg of protein) are presented as the mean ± SEM n = 7 samples pulled from 3 independent experiments. * p < 0.05 paired Student’s t-test. D Scatter dot plot showing the glutamate quantification in astrocytes cultured in GCM with or without β-HB, stimulated with Glutamate in absence or presence of the UCPH-101 and DHK specific inhibitors of GLAST and GLT-1 transporters. Data (nmol/mg of protein) are presented as the mean ± SEM n = 5–6 samples pulled from 3 independent experiments. * p < 0.05, one-way ANOVA
Fig. 5
Fig. 5
Astrocytes and β-HB effect on GL261 proliferation and spontaneous calcium activity. A Scatter dot plot showing the MTT assay on GL261 cells co-cultured with astrocytes and β-HB. Data are presented as the mean ± SEM n = 10 to 18 samples pulled from 3 independent experiments. *** p < 0.001** p < 0.01 *p < 0.05; One-way ANOVA, Tukey’s multiple comparison test. B Scatter dot plot showing the percentage of GL261rfp and astrocytes cultured with or without β-HB. Bottom panel: representative immunofluorescence pictures of the direct co-culture between GL26rfp and astrocytes (identified by phase contrast microscope acquisitions, scale bar: 50 μm). Data are presented as the mean ± SEM n = 18–19 analyzed fields of view pulled from n = 3 independent experiments. *** p < 0.001, *p < 0.05; Two-way ANOVA, Fisher’s LSD test. C Left panel: Scatter dot plot showing the effect of β-HB and astrocytes on the basal Ca2+ level of GL261rfp. Data are presented as the mean ± SEM n = 178–260 cells analyzed from 3 independent experiments. *** p < 0.001; Two-way ANOVA, Fisher’s LSD test. Right panel) Scatter dot plot showing the basal Ca2+ level of astrocytes co-cultured with GL261rfp and stimulated with vehicle or β-HB. D Left panel: Bar graph showing the number of spontaneous events recorded in GL261rfp co-cultured or not with astrocytes, with or without β-HB stimulation. (*** p < 0.001) Right panel: Bar graph showing the number of spontaneous events recorded in astrocytes co-cultured with GL261.rfp and stimulated with vehicle or β-HB. (*** p < 0.001)

References

    1. Elsakka AMA, Bary MA, Abdelzaher E, Elnaggar M, Kalamian M, Mukherjee P, Seyfried TN (2018) Management of glioblastoma multiforme in a patient treated with ketogenic metabolic therapy and modified standard of care: a 24-month follow-up. Front Nutr 29(5):20. 10.3389/fnut.2018.00020 - PMC - PubMed
    1. Mukherjee P, Augur ZM, Li M, Hill C, Greenwood B, Domin MA, Kondakci G, Narain NR, Kiebish MA, Bronson RT, Arismendi-Morillo G, Chinopoulos C, Seyfried TN (2019) Therapeutic benefit of combining calorie-restricted ketogenic diet and glutamine targeting in late-stage experimental glioblastoma. Commun Biol 29(2):200. 10.1038/s42003-019-0455-x - PMC - PubMed
    1. Maeyama M, Tanaka K, Nishihara M, Irino Y, Shinohara M, Nagashima H, Tanaka H, Nakamizo S, Hashiguchi M, Fujita Y, Kohta M, Kohmura E, Sasayama T (2021) Metabolic changes and anti-tumor effects of a ketogenic diet combined with anti-angiogenic therapy in a glioblastoma mouse model. Sci Rep 11(1):79 - PMC - PubMed
    1. Maurer GD, Brucker DP, Bähr O, Harter PN, Hattingen E, Walenta S, Mueller-Klieser W, Steinbach JP, Rieger J (2011) Differential utilization of ketone bodies by neurons and glioma cell lines: a rationale for ketogenic diet as experimental glioma therapy. BMC Cancer 26(11):315. 10.1186/1471-2407-11-315 - PMC - PubMed
    1. Ciusani E, Vasco C, Rizzo A, Girgenti V, Padelli F, Pellegatta S, Fariselli L, Bruzzone MG, Salmaggi A (2021) MR-spectroscopy and survival in mice with high grade glioma undergoing unrestricted ketogenic diet. Nutr Cancer 73(11–12):2315–2322. 10.1080/01635581.2020.1822423 - PubMed

LinkOut - more resources