

Molecular effects of clinically relevant chemotherapeutic agents on choline phospholipid metabolism in triple negative breast cancer cells
- PMID: 39922048
- PMCID: PMC11849126
- DOI: 10.1016/j.tranon.2025.102311
Molecular effects of clinically relevant chemotherapeutic agents on choline phospholipid metabolism in triple negative breast cancer cells
Abstract
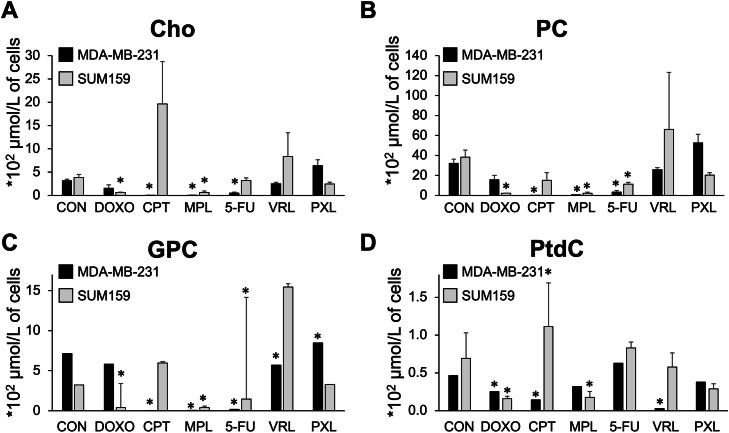
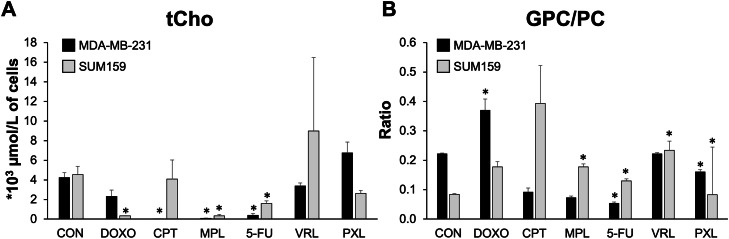
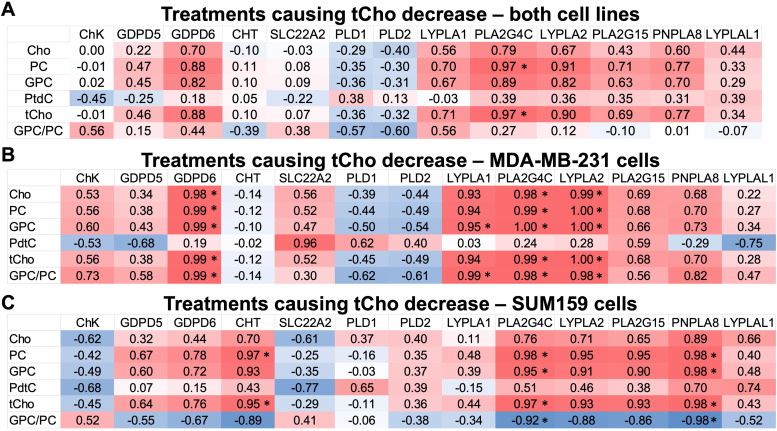
Triple-negative breast cancer (TNBC) is the most lethal breast cancer subtype, leading to poor patient outcomes despite aggressive treatment with surgery, radiation, and chemotherapy. There are currently no clinical tests available which measure early on whether TNBC patients respond to the selected chemotherapy treatment regimen. The magnetic resonance spectroscopy (MRS)-detected total choline (tCho) signal was shown to be a promising biomarker for assessing the response to chemotherapy treatment early on, as breast tumor tCho decreases after the first treatment cycle in patients who respond to chemotherapy cocktails. We sought to further investigate these clinical observations at the molecular level by combining metabolic and transcriptomic studies in two human TNBC cell lines treated with six different chemotherapeutic agents. Overall, our findings show that the glycerophosphocholine-to-phosphocholine ratio (GPC/PC) was a more sensitive and more broadly applicable measure of TNBC response to various chemotherapeutic agents than tCho. Specific chemotherapeutic drugs, including 5-fluorouracil and melphalan, resulted in the most significant effects on choline phospholipid metabolism, while other drugs did not significantly alter choline phospholipid metabolism. Overall, several of the six tested chemotherapeutic drugs mainly affected the expression levels of phosphatidylcholine (PtdC)-specific phospholipases and lysophospholipases, leading to the observed GPC/PC and tCho changes following treatment with the chemotherapeutic agents that altered choline phospholipid metabolism. The presented metabolic and transcriptomic findings support that the GPC/PC ratio and PtdC-phospholipases and -lysophospholipases could be further developed for assessing the response to chemotherapy treatment in TNBC patients. Statement of Significance: We show that the glycerophosphocholine-to-phosphocholine ratio and phosphatidylcholine-specific-phospholipases and -lysophospholipases are reliable markers for assessing the response to several chemotherapeutic agents, which could help with selecting correct treatments for TNBC patients.
Keywords: Chemotherapy; Choline; Magnetic resonance; Metabolism; Phospholipid; Spectroscopy; Treatment response.
Copyright © 2025. Published by Elsevier Inc.
Conflict of interest statement
Declaration of competing interest The authors declare that they have no known competing financial interests or personal relationships that could have appeared to influence the work reported in this paper.
Figures


References
-
- Ferlay J., Colombet M., Soerjomataram I., Parkin D.M., Pineros M., Znaor A. Cancer statistics for the year 2020: an overview. Int. J. Cancer. 2021 - PubMed
-
- Dent R., Trudeau M., Pritchard K.I., Hanna W.M., Kahn H.K., Sawka C.A. Triple-negative breast cancer: clinical features and patterns of recurrence. Clin. Cancer Res. 2007;13:4429–4434. - PubMed
-
- Partridge A.H., Rumble R.B., Carey L.A., Come S.E., Davidson N.E., Leo A.D. Chemotherapy and targeted therapy for women with Human epidermal growth factor receptor 2–Negative (or unknown) advanced breast cancer: American Society of Clinical Oncology Clinical Practice Guideline. J. Clin. Oncol. 2014;32:3307–3329. - PMC - PubMed
Grants and funding
LinkOut - more resources
Full Text Sources
