. 2025 Mar 20;188(6):1693-1710.e18.
doi: 10.1016/j.cell.2024.12.031. Epub 2025 Feb 7.

Multiple independent acquisitions of ACE2 usage in MERS-related coronaviruses

Affiliations

Multiple independent acquisitions of ACE2 usage in MERS-related coronaviruses

Cheng-Bao Ma et al. Cell. .

Abstract

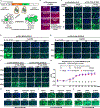
The angiotensin-converting enzyme 2 (ACE2) receptor is shared by various coronaviruses with distinct receptor-binding domain (RBD) architectures, yet our understanding of these convergent acquisition events remains elusive. Here, we report that two bat MERS-related coronaviruses (MERSr-CoVs) infecting Pipistrellus nathusii (P.nat)-MOW15-22 and PnNL2018B-use ACE2 as their receptor, with narrow ortholog specificity. Cryoelectron microscopy structures of the MOW15-22/PnNL2018B RBD-ACE2 complexes unveil an unexpected and entirely distinct binding mode, mapping >45 Å away from that of any other known ACE2-using coronaviruses. Functional profiling of ACE2 orthologs from 105 mammalian species led to the identification of host tropism determinants, including an ACE2 N432-glycosylation restricting viral recognition, and the design of a soluble P.nat ACE2 mutant with potent viral neutralizing activity. Our findings reveal convergent acquisition of ACE2 usage for merbecoviruses found in European bats, underscoring the extraordinary diversity of ACE2 recognition modes among coronaviruses and the promiscuity of this receptor.

Keywords: ACE2; ACE2-using merbecoviruses; MERS-related coronaviruses; MOW15-22; PnNL2018B; bat; merbecoviruses; receptor; receptor-binding domain.


Conflict of interest statement

Declaration of interests H.Y. has submitted a patent application to the China National Intellectual Property Administration for the utilization of propagation-competent VSV to evaluate amplification of ACE2-using merbecoviruses in bat ACE2-expressing cells.

Figures

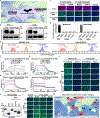
Figure 1.
Figure 1.. Prediction of a distinct receptor recognition mode utilized by two MERSr-CoVs.
(A-B) Phylogenetic trees of representative merbecoviruses were generated using complete genome nucleotide sequences (A) or S glycoprotein amino acid sequences (B) with the IQ-tree method. NL63 was set as an outgroup. Amino acid sequence identities of five replicase domains (3CLpro, NiRAN, RdRp, ZBD, and HEL1) for coronavirus classification, host species, and receptor-related information (receptor usage, binding mode, and availability of RBD/receptor complex structure) are indicated. The scale bar represents 1 substitution per nucleotide/amino acid position. (C) Simplot analysis of the complete genome sequence similarity of several MERSr-CoVs analyzed based on the MOW15–22 genome. The right panel magnifies the RBD and adjacent regions. The boundaries of RBD (green) and RBM (red) coding regions are indicated by dotted lines. (D) Pairwise RBD and S amino acid sequence identities of indicated merbecoviruses. (E) RBM sequence alignment of the indicated merbecoviruses. MOW15–22 and PnNL2018B-specific insertions and disulfide are indicated in red and yellow, respectively. Red/black asterisks: residues crucial for NeoCoV interactions with P.pip ACE2 that are conserved/not conserved with MOW15–22 and PnNL2018B. The MOW15–22 residue numbering is shown. (F) Ribbon diagrams of experimentally determined structures or AlphaFold2-predicted structures of representative merbecovirus RBDs. Magenta indicates putative RBMs, and blue represents the RBM helix. Black arrows indicate the MOW15–22 and PnNL2018B-specific RBM insertions (Ins1 and Ins2). The yellow sticks represent the MOW15–22/PnNL2018B-specific disulfide bond in Ins1.
Figure 2.
Figure 2.. MOW15–22 and PnNL2018B use ACE2 as receptor.
(A) Geographical distribution of Pipistrellus nathusii habitat (purple) in Europe. Data were retrieved from the IUCN (International Union for Conservation of Nature) Red List of Threatened Species, and the distribution chart was generated using Geoscene Pro. Red asterisks: discovery locations. (B) Expression levels of membrane-anchored human and P.nat ACE2 and DPP4 orthologs transiently transfected in HEK293T cells. (C-D) P.nat ACE2 but not P.nat DPP4 supports MOW15–22 and PnNL2018B RBD-hFc binding (C) and pseudovirus (PSV) entry (D) in HEK293T cells. Data are represented as mean ± SD for n=4 biological replicates. RLU: Relative light unit. (E) Flow cytometry analysis of MOW15–22 and PnNL2018B S1 binding to P.nat ACE2, hACE2 or P.nat DPP4 transiently expressed at the surface of HEK293T cells. White: vector control. Data shown are the mean of three technical repeats. (F-I) BLI analyses of binding kinetics of the dimeric (F-G) or monomeric (H-I) P.nat ACE2 ectodomains to immobilized monomeric biotinylated MOW15–22 RBD (F, H) or PnNL2018B RBD (G, I) immobilized on SA biosensors. Analysis was conducted with curve-fitting kinetic with global fitting (1:1 binding model) for F, H, and steady-state fitting for G. The fits are shown as black lines for F and H. ND: not determined. The color keys indicate the concentration of ACE2 used. (J) Binding of hFc-fused recombinant MOW15–22 and PnNL2018B RBDs and S1 subunits (4 μg/ml) to P.nat ACE2 transiently expressed at the surface of HEK293T cells and detected by immunofluorescence. (K) Expression levels of hFc-fused recombinant proteins comprising different domains of the PnNL2018B S1 subunit. Equal volumes of protein-containing supernatants used for purification were loaded for Western blot analysis. (L) Binding of the PnNL2018B RBDs and S1 subunits at various concentrations to HEK293T cells transiently expressing P.nat ACE2 analyzed by immunofluorescence. (M) Confirmed DPP4 or ACE2 usage of representative merbecoviruses is displayed with blue and red backgrounds, respectively. Discovery locations and natural hosts are indicated. Scale bars: 100 μm for C, J, and L.
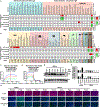
Figure 3.
Figure 3.. Multi-species ACE2 tropism of MOW15–22 and PnNL2018B.
(A-B) Heat map representing MOW15–22 PSV entry into and RBD/S1 subunit (4 μg/ml) binding to HEK293T cells transiently expressing various ACE2 orthologs from bats (A) or other mammalian species (B). Different mammalian orders are denoted with backgrounds of distinct colors, from left to right: Carnivora, Primates, Artiodactyla, Rodentia, Cetacea, Perissodactyla, Diprotodontia, Pholidota, Erinaceomorpha, Lagomorpha, and Chiroptera. Data are normalized relative to P.nat ACE2 and shown as mean values. Heatmaps are plotted as mean values (n=3 biological replicates). Data are representative of two independent experiments. (C-D) BLI analysis of binding kinetics of the dimeric (C) or monomeric (D) P.dav ACE2 ectodomains to biotinylated monomeric MOW15–22 RBD immobilized on SA biosensors. Analysis was conducted with curve-fitting kinetic with global fitting (1:1 binding model) and the fits are shown as black lines. The color keys indicate the concentration of ACE2 used. (E) Expression levels of several mammalian DPP4 orthologs in HEK293T cells. (F) PSV entry efficiency of MOW15–22 and PnNL2018B in HEK293T cells transiently expressing the indicated receptors. Dashed lines: threshold of the background entry. Data are represented as mean for n=3 biological replicates. (G) MOW15–22 and PnNL2018B RBD-hFc binding to HEK293T cells transiently expressing the indicated receptors assessed by immunofluorescence. Scale bars: 100 μm. See also Figure S1–S2.
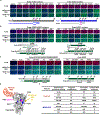
Figure 4.
Figure 4.. Host ACE2 tropism determinants for MOW15–22 and PnNL2018B.
(A) MOW15–22 RBD and S1 subunit binding to HEK293T cells transiently expressing ACE2 chimeras with sequence swaps between M.bla and P.dav ACE2s analyzed by immunofluorescence. (B) MOW15–22 RBD and S1 subunit binding to HEK293T cells transiently expressing ACE2 chimeras with sequence swaps between P.pip ACE2-N432C and P.nat ACE2 analyzed by immunofluorescence. (C) MOW15–22 RBD and S1 subunit binding to HEK293T cells transiently expressing ACE2 chimeras with sequence swaps between P.pip ACE2 N432C/E589K/K597E mutant and P.nat ACE2 analyzed by immunofluorescence. (D) Summary of key receptor host range determinants for MOW15–22 and PnNL2018B highlighted in blue on the P.pip ACE2 surface (PDB 7WPO). The N432-glycan is rendered in magenta. (E) Summary of ACE2 residues and glycans governing receptor utilization for NeoCoV and MOW15–22. The contribution of N-glycans to receptor binding and representative favorable/unfavorable ACE2 residues are indicated. (+): residue promoting binding; (): residue restricting binding; NA: not applicable (not glycosylation site). The P.pip ACE2 residue numbering is shown. Residue positions, N432P.pipACE2 glycans (in magenta), and swap strategies are indicated with the schematic below each panel in A, B, and C. Scale bars:100 μm. See also Figure S3–S4.
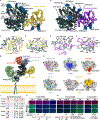
Figure 5.
Figure 5.. Structural basis for MOW15–22 binding with bat ACE2.
(A-B) Cryo-EM structure of the MOW15–22 RBD bound to the P.dav ACE2 ectodomain (A) and the PnNL2018B RBD bound to the P.nat.M2 ACE2 ectodomain (B). The ACE2 dimerization domains are omitted for clarity. (C-F) Zoomed-in views of key interactions mediating MOW15–22 RBD (yellow) binding to P.dav ACE2 (dark green) (C-D) and PnNL2018B RBD (purple) binding to P.nat.M2 ACE2 (dark green) (E-F). Selected salt bridges and hydrogen bonds are shown as black dotted lines. (G) Comparison of the binding modes of the MOW15–22, NeoCoV (PDB 7WPO), SARS-CoV-2/SARS-CoV-1 (PDB 7TN0), NL63 (PDB 3KBH) and HKU5–19s (PDB 9D32) RBDs on bat (not shown for clarity) or hACE2 (PDB 6M1D, B0AT1 not shown for clarity). (H) RBD footprints of the five ACE2-using coronaviruses. N-terminus labeled in green. Average areas of the buried interaction interfaces are indicated for the indicated viruses. (I) Schematic of critical residues responsible for species-specific receptor recognition in selected ACE2 orthologs. (J) P.nat ACE2 mutants with reduced MOW15–22 RBD or S1 subunit binding due to unfavorable substitutions to hydrophobic interactions. (K) Human or P.kuh ACE2 mutants with improved MOW15–22 RBD or S1 subunit binding due to favorable substitutions mapping to the N432-glycosylation site, hydrophobic interactions, or polar interactions. See also Figure S5–S6 and Table S1–S3.
Figure 6.
Figure 6.. Characterization and inhibition of MOW15–22 and PnNL2018B ACE2-mediated entry.
(A) Quantification of S glycoprotein incorporation in VSV pseudotypes analyzed by Western blot detecting the C-terminal-fused HA tags. VSV-M was used as a loading control. (B) Sequence analysis of S glycoprotein S1/S2 junction (dashed box) from the indicated viruses, with arginine highlighted in red. (C-D) MOW15–22 S-mediated cell-cell fusion using Caco2 cells stably expressing P.nat ACE2 upon addition of TPCK-treated trypsin. The signal resulting from the reconstitution of split sfGFP (C) or RLuc (D) is indicated. Data are represented as mean ± SD for n=3 biological replicates in D. Scale bars:200 μm. (E-F) BLI analyses of binding kinetics of soluble dimeric ACE2 ectodomains from P.nat.M1 ACE2 (E) and P.nat.M2 ACE2 (F) carrying P.dav ACE2 equivalent residues (red) to immobilized MOW15–22 RBD-hFc. Global fitting to the data using a 1:1 binding model is shown in black. (G) Superimposition of the cryoEM structures of the MOW15–22 RBD (gold) in complex with P.dav ACE2 (not shown for clarity) and of the MOW15–22 RBD (blue) bound to P.nat.M2 ACE2 (dark green) superimposed based on the ACE2 peptidase domain. (H) Dose-dependent inhibition of MOW15–22 pseudovirus entry mediated by soluble P.dav, P.nat, P.nat.M2 and human ACE2s in Caco2 cells stably expressing P.nat ACE2. IC50 values are indicated. N.D.: Not detectable. (I-L) Inhibitory activities of small compounds or peptide inhibitors against MOW15–22 and PnNL2018B pseudoviruses using Caco2 cells stably expressing the hACE2–3M mutant (Q287K/N432C/E589K). Endosomal acidification inhibitor bafilomycin A1 (Baf-A1) (I), cathepsin L inhibitor E64d (J), TMPRSS2 inhibitor camostat (K), S2-targeting HR2-derived peptide fusion inhibitor EK1C4 (L). (M-P) Dose-dependent inhibition of MOW15–22 and PnNL2018B pseudoviruses by S2P6 and 76E1 (M-N), or h11B11 (O-P) in the Caco2-hACE2–3M cells. For I-P, data are representative of two independent experiments with similar results (n=2 biological replicates). See also Figure S7 and Table S1.
Figure 7.
Figure 7.. MOW15–22 and PnNL2018B S-mediated propagation supported by ACE2.
(A) Genetic organization and amplification of pcVSV-MOW15–22-S and pcVSV-PnNL2018B-S. (B) Immunofluorescence analyzing the expression of P.nat and human ACE2 mutants stably expressed in Caco2 cells. (C) GFP signal from TPCK-trypsin-enhanced amplification of pcVSV-MOW15–22-S and pcVSV-PnNL2018B-S in Caco2 cells with or without the expression of P.nat ACE2 at 24hpi. (D-E) Propagation of pcVSV-MOW15–22-S (D) and pcVSV-PnNL2018B-S (E) in Caco2 cells stably expressing hACE2 carrying N432C (1M), N432C/E589K (2M), Q287K/N432C/E589K (3M) mutants, with P.nat ACE2 as a positive control. (F) Representative fluorescence images of pcVSV-MOW15–22-S and pcVSV-PnNL2018B-S amplification in Caco2 cells expressing P.nat ACE2 or P.nat ACE2-C432N mutants at 12, 24 and 36-hour post-infection (hpi). (G) pcVSV-MOW15–22-S propagation kinetics in Caco2 cells expressing P.nat ACE2 or P.nat ACE2-C432N mutants at the indicated time points. Data are represented as mean ± SD for n=3 biological replicates. RFU: relative fluorescence unit. TPCK-treated trypsin was present in the cells at 20 μg/mL (DMEM+2%FBS) in D, E, F, and G. (H-J) pcVSV-MOW15–22-S propagation in the presence of indicated inhibitors in 293T-hACE2–3M cells (H), Caco2-hACE2–3M cells (I), or indicated antibodies in Caco2-hACE2–3M cells (J). BSA: Bovine serum albumin, 50 μg/ml. hpi: hours post-infection. Scale bars:200 μm. See also Figure S7.

References

    1. CSR MERS outbreaks. World Health Organization - Regional Office for the Eastern Mediterranean. https://www.emro.who.int/health-topics/mers-cov/mers-outbreaks.html.
    1. Alagaili AN, Briese T, Mishra N, Kapoor V, Sameroff SC, Burbelo PD, de Wit E, Munster VJ, Hensley LE, Zalmout IS, et al. (2014). Middle East respiratory syndrome coronavirus infection in dromedary camels in Saudi Arabia. MBio 5, e00884–14. 10.1128/mBio.00884-14. - DOI - PMC - PubMed
    1. Meyer B, Müller MA, Corman VM, Reusken CBEM, Ritz D, Godeke G-J, Lattwein E, Kallies S, Siemens A, van Beek J, et al. (2014). Antibodies against MERS coronavirus in dromedary camels, United Arab Emirates, 2003 and 2013. Emerg. Infect. Dis. 20, 552–559. 10.3201/eid2004.131746. - DOI - PMC - PubMed
    1. Memish ZA, Cotten M, Meyer B, Watson SJ, Alsahafi AJ, Al Rabeeah AA, Corman VM, Sieberg A, Makhdoom HQ, Assiri A, et al. (2014). Human infection with MERS coronavirus after exposure to infected camels, Saudi Arabia, 2013. Emerg. Infect. Dis. 20, 1012–1015. 10.3201/eid2006.140402. - DOI - PMC - PubMed
    1. Mohd HA, Al-Tawfiq JA, and Memish ZA (2016). Middle East Respiratory Syndrome Coronavirus (MERS-CoV) origin and animal reservoir. Virol. J. 13, 87. 10.1186/s12985-016-0544-0. - DOI - PMC - PubMed

MeSH terms

Substances

LinkOut - more resources