. 2025 Feb 18;6(2):101938.
doi: 10.1016/j.xcrm.2025.101938. Epub 2025 Feb 7.

Bioengineering of a human iPSC-derived vascularized endocrine pancreas for type 1 diabetes

Affiliations

Bioengineering of a human iPSC-derived vascularized endocrine pancreas for type 1 diabetes

Francesco Campo et al. Cell Rep Med. .

Abstract

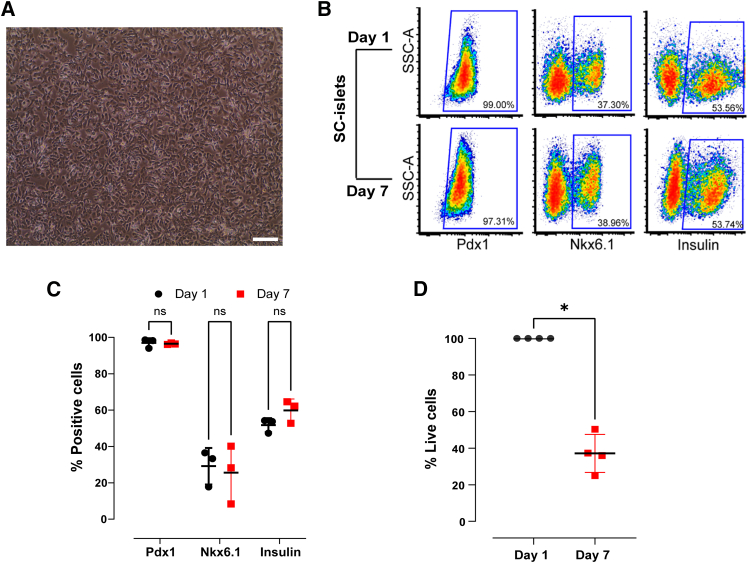
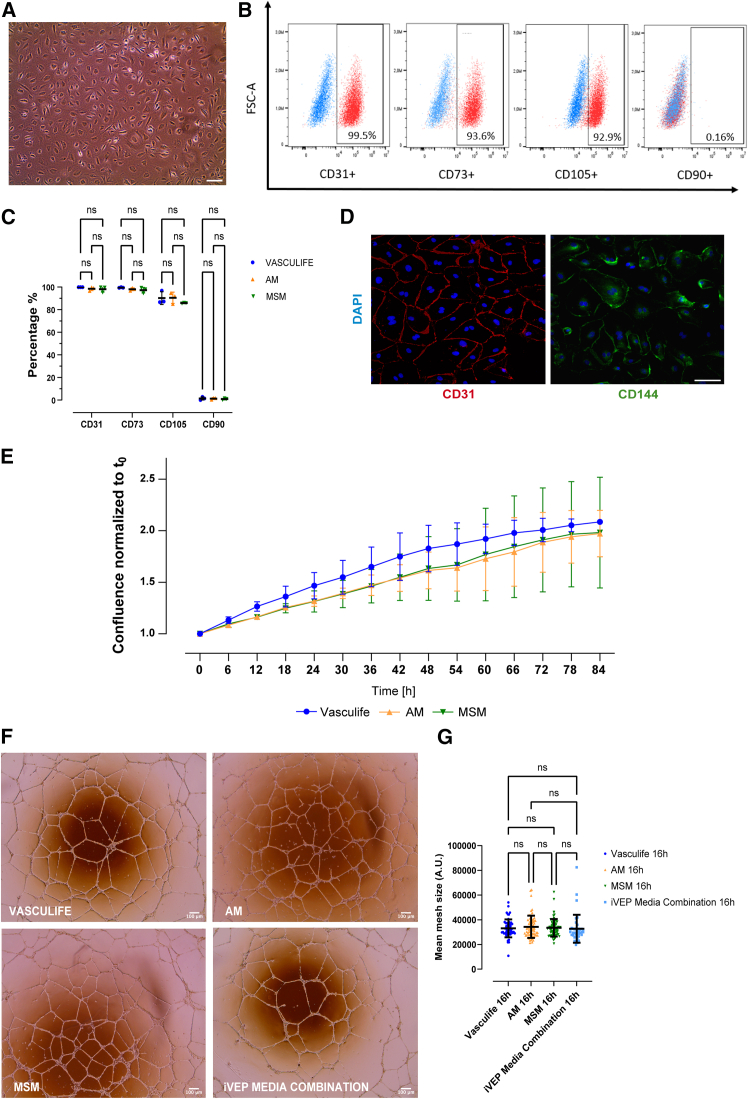
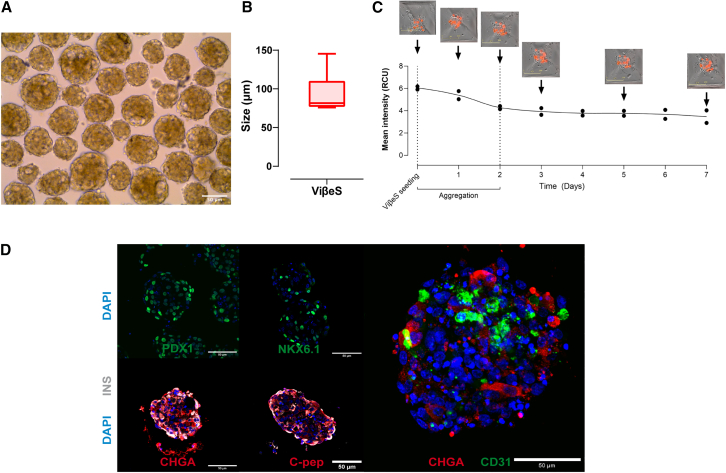
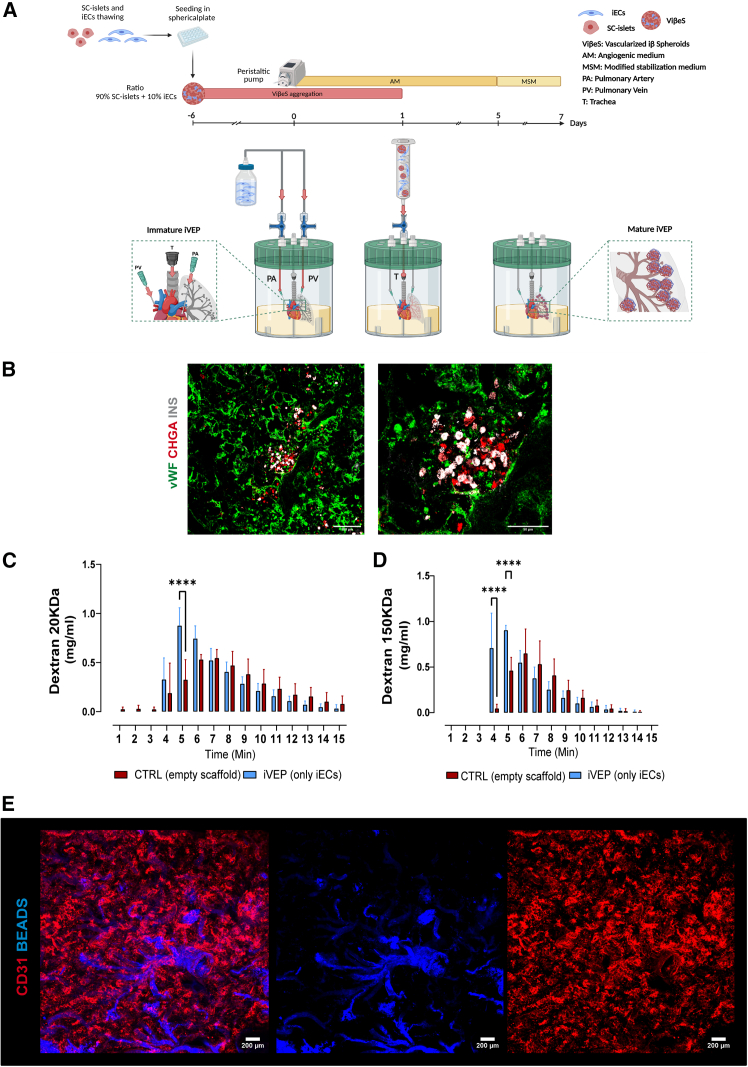
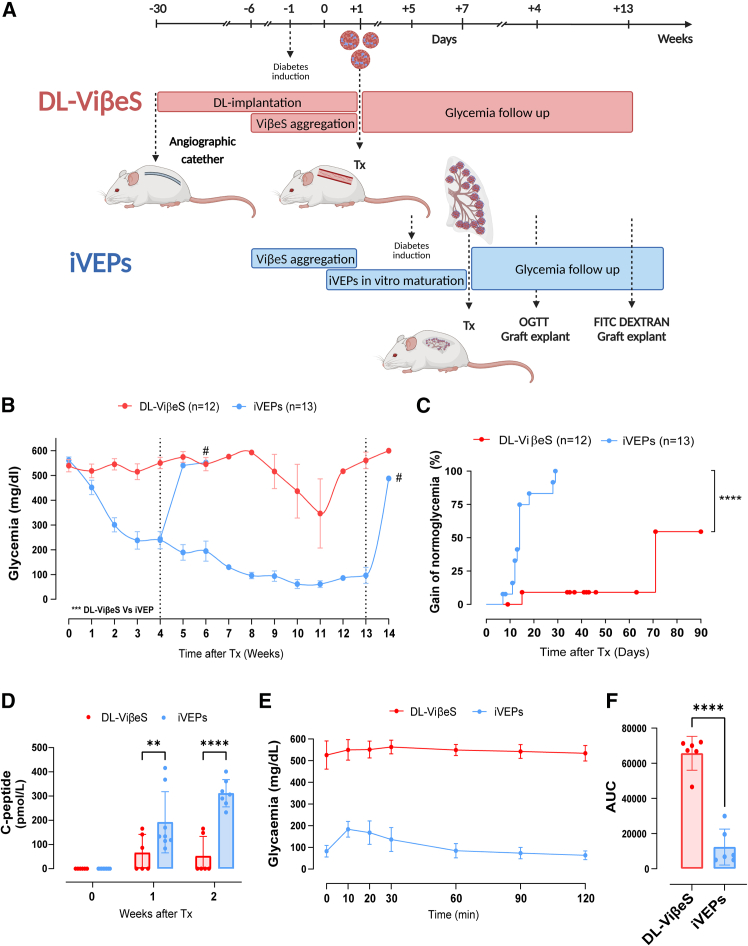
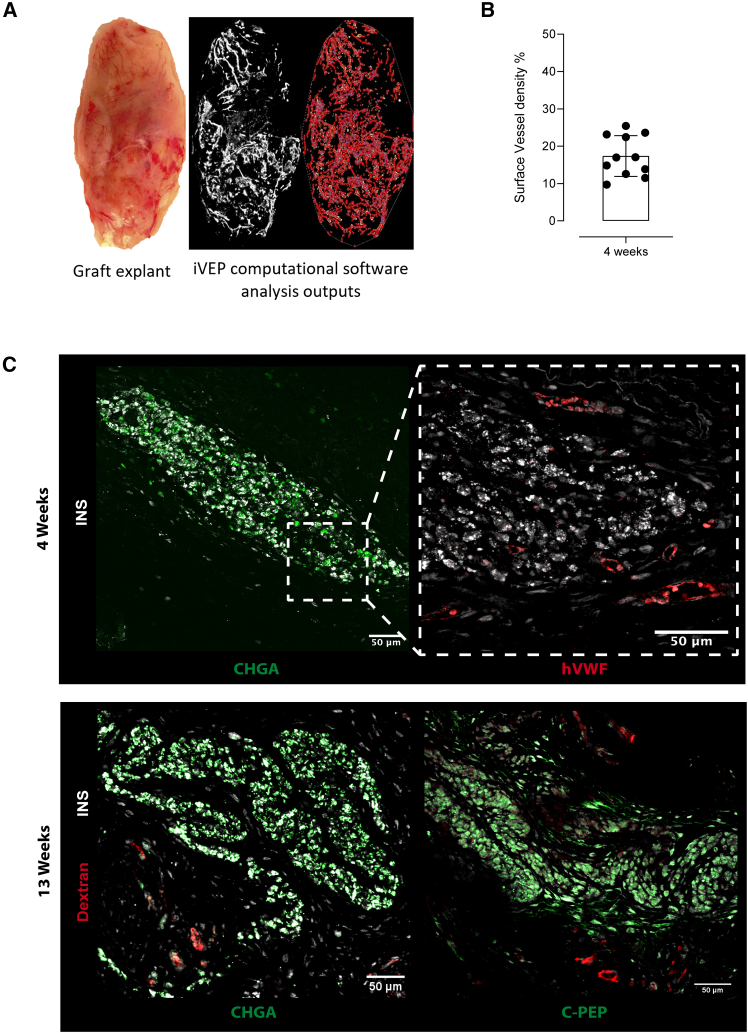
Intrahepatic islet transplantation in patients with type 1 diabetes is limited by donor availability and lack of engraftment. Alternative β cell sources and transplantation sites are needed. We demonstrate the feasibility to repurpose a decellularized lung as an endocrine pancreas for β cell replacement. We bioengineer an induced pluripotent stem cell (iPSC)-based version, fabricating a human iPSC-based vascularized endocrine pancreas (iVEP) using iPSC-derived β cells (iPSC-derived islets [SC-islets]) and endothelial cells (iECs). SC-islets and iECs are aggregated into vascularized iβ spheroids (ViβeSs), and over 7 days of culture, spheroids integrate into the bioengineered vasculature, generating a functional, perfusable human endocrine organ. In vitro, the vascularized extracellular matrix (ECM) sustained SC-islet engraftment and survival with a significantly preserved β cell mass and a physiologic insulin release. In vivo, iVEP restores normoglycemia in diabetic NSG mice. We report a human iVEP providing a controlled in vitro insulin-secreting phenotype and in vivo function.

Keywords: beta cell replacement; extracellular matrix; human iPSC vascularized endocrine spheroids; iPSCs; induced pluripotent stem cells; islet transplantation; lung scaffold; organ decellularization; organ engineering for type 1 diabetes; pancreas bioengineering; tissue engineering; type 1 diabetes.


Conflict of interest statement

Declaration of interests The authors declare no competing interests.

Figures

None
Graphical abstract
Figure 1
Figure 1
SC-islet characterization for iVEP assembly (A) Representative bright-field image of SC-islets in standard culture condition. (B) Representative SC-islet flow cytometry characterization for Pdx1, Nkx6.1, and insulin at day 1 and day 7 post culture. (C) Flow cytometry quantification of Pdx1, Nkx6.1, and insulin expression in SC-islets at day 1 and day 7 after standard culture (values are presented as mean ± SD, Pdx1: day 1 96.95% ± 2.57% vs. day 7 96.48% ± 0.44%, Nkx6.1: day 1 29.17% ± 10.04% vs. day 7 25.62% ± 16.056%, and insulin: day 1 51.74% ± 3.86% vs. day 7 59.85% ± 6.27%; n = 3 biological replicates; two-way ANOVA). (D) Quantification of SC-islet live cells after 7 days of culture (∗100% at day 1 vs. 37.16% ± 10.38% at day 7; values are presented as mean ± SD, n = 4 biological replicates, Mann-Whitney U test p = 0.0286).
Figure 2
Figure 2
iEC characterization for iVEP assembly (A) Representative bright-field image of iECs in standard culture condition. (B) Representative iEC flow cytometry characterization for CD90, CD31, CD105, and CD73 post culture used for iVEP engineering. (C) Flow cytometry quantification of CD90, CD31, CD105, and CD73 expression in iECs at different passages after standard culture in different culture media used for iVEP engineering (n = 3 biological replicates). Values are presented as mean ± SD. (D) Immunofluorescence staining of iEC endothelial phenotyping CD31 (red), VE-cadherin (CD144, green), and DAPI (blue). (E) Proliferation assay by Incucyte. Proliferation index of iECs in iVEP culture media (AM and MSM) vs. VascuLife medium as control, with respect to time 0 confluence. Values are presented as mean ± SD (n = 3 biological replicates). (F) Representative images of iEC morphology in tube formation assays using iVEP media combination, modified stabilization medium (MSM), angiogenic medium (AM), and VascuLife medium. Magnification 4×. (G) Tube formation assay quantification and analysis of the formed vascular mesh in VascuLife, AM, MSM, and iVEP media combination. Scale bars in μm (n = 3 independent experiments, biological replicates. For each condition (VascuLife, AM, MSM, and iVEP media combination), 56, 68, 69, and 39 images were acquired, respectively. Values are presented as mean ± SD.
Figure 3
Figure 3
ViβeS characterization (A) Representative image of ViβeSs at day 7 upon harvesting. (B) ViβeS size quantification (n = 8 biological independent ViβeS replicates; for each replicate, the size of 42, 82, 29, 38, 33, 49, 62, and 57 spheroids were measured, respectively). (C) ViβeS assembly longitudinal observation. iECs stained in red and observed during culture through fluorescence quantification by mean intensity. n = 2 biological replicates. (D) Immunofluorescence staining of ViβeSs before seeding in iVEP: iECs positive for human CD31 in green, SC-islets positive for human Pdx1, human Nkx6.1 in green, human CHGA, human C-pep in red, and human insulin (INS) in gray.
Figure 4
Figure 4
iVEP assembly and in vitro functional characterization of vascular compartment (A) Representative image of iVEP engineering protocol. (B) Representative image of mature and fully engineered iVEP, with continuous vascular network (human vWF+ in green) and ViβeSs (human CHGA+ in red and human INS+ in gray) fully engrafted and surrounded by iECs. (C and D) FITC-dextran assay release kinetics. iVEPs were perfused at 1 mL/min with FITC-dextran at two different molecular weights 20 and 150 kDa, respectively. n = 4 iVEPs vs. n = 4 CTRL empty scaffolds for each MW, n = 4 refers to biological replicates. (E) Fluorescence microsphere perfusion: 0.2-μm microspheres (beads, blue) present and retained in newly formed iVEP vasculature (human CD31, red). Scale bars in μm.
Figure 5
Figure 5
In vitro functional evaluation of iVEP endocrine compartment: insulin secretion performance and ViβeS survival (A) Dynamic insulin secretion test of iVEP (cyan line, n = 9 biological replicates) vs. batch-matched ViβeSs (red line, n = 7 biological replicates) after 7 days of dynamic culture with low (0.5 mM) and high (11 mM) glucose stimuli. Values are expressed as fold change over the basal (iVEP vs. ViβeS Mann-Whitney U test). Values are presented as mean ± SEM. (B) Area under the curve (AUC) analysis of insulin secretion test from min 2 to 7. Analysis of iVEPs (n = 9 biological replicates) and ViβeS (n = 7 biological replicates) performance. AUC peak iVEP vs. ViβeS Welch t test; values are presented as mean ± SEM. (C) Released miR-375 kinetics (absolute copies in supernatant) during 7 days of culture of mature iVEPs (cyan, n = 13 biological replicates) and iVEPs seeded with iECs only (green, n = 2 biological replicates). Values are presented as mean ± SEM. (D) Percentage of β cell death quantified during the 7 days of iVEP maturation culture (n = 13 biological replicates). Values are presented as mean ± SD. (E) Percentage of overall β cell death during the 7 days maturation of iVEPs (cyan, n = 13 biological replicates) vs. SC-islets in standard culture (red, n = 4 biological replicates). Values are presented as mean ± SEM, p = 0.0008, Mann-Whitney U test.
Figure 6
Figure 6
iVEP in vivo endocrine performance (A) Schematic representation of in vivo experimental plan for iVEP transplantation in immunocompromised diabetic mouse models. (B) Daily not fasting glycemia profile comparison between DL-ViβeSs (red, n = 12 recipients) and iVEPs (cyan, n = 13 recipients) for 13 weeks of follow-up (# represent iVEP explant at 4 and 13 weeks, n = 1 explant, respectively). Values are presented as mean ± SEM. DL-ViβeSs vs. iVEPs p = 0.0035, general linear model, repeated measures. (C) Kaplan-Meier analysis of the percentage of mice reaching normoglycemia (three consecutive measurements ≤200 mg/dL). Differences between iVEPs and DL-ViβeSs were estimated by log rank test ∗∗∗∗p < 0.0001. Median time to reach normoglycemia iVEP 14 ± 1.9 days (D) C-peptide quantification at 0, 7, and 14 days after transplantation in iVEP and DL-ViβeS graft bearing recipients. Day 7: DL-ViβeSs (red, n = 6 recipients) vs. iVEPs (cyan, n = 8 recipients) ∗∗p = 0.0099. Day 14: DL-ViβeSs (red, n = 6 recipients) vs. iVEPs (cyan, n = 7 recipients) ∗∗∗∗p < 0.0001. Differences between iVEPs and DL-ViβeS were estimated by two-way ANOVA analysis. Values are presented as mean ± SD. (E) OGTT of iVEPs and DL-ViβeS recipients at 4 weeks after transplantation. iVEPs (n = 6) vs. DL-ViβeS (n = 6) recipients. Values are presented as mean ± SEM. (F) AUC quantification of glycemia profile after OGTT. iVEPs (n = 6) vs. DL-ViβeS (n = 6) recipients. Welch’s t test ∗∗∗∗p < 0.0001. Values are presented as mean ± SEM.
Figure 7
Figure 7
Ex vivo iVEP characterization (A) Gross pathology of 4-week iVEP explants (left) and its computational software analysis of vascular iVEP surface density (middle-right). (B) Percentage of iVEP surface vessel density at 4 weeks after implantation. Values are presented as mean ± SD; average vessel surface density (17.38 ± 5.46), (n = 11 explants). (C) Representative IF staining of explanted graft at 4 and 13 weeks after transplantation. Top: left image: ViβeSs (human CHGA+ in green and human INS+ in gray). Right image: ViβeSs (human INS+ in gray) and iECs (human vWF+ in red). Bottom: left image: dextran in red, ViβeSs (human CHGA+ in green and human INS+ in gray). Right image: dextran in red, ViβeSs (human C-pep+ in green and human INS+ in gray).

References

    1. Gregory G.A., Robinson T.I.G., Linklater S.E., Wang F., Colagiuri S., de Beaufort C., Donaghue K.C., International Diabetes Federation Diabetes Atlas Type 1 Diabetes in Adults Special Interest Group. Magliano D.J., Maniam J. Global incidence, prevalence, and mortality of type 1 diabetes in 2021 with projection to 2040: a modelling study. Lancet Diabetes Endocrinol. 2022;10:741–760. - PubMed
    1. Beck R.W., Bergenstal R.M., Laffel L.M., Pickup J.C. Advances in technology for management of type 1 diabetes. Lancet. 2019;394:1265–1273. - PubMed
    1. Piemonti L. Felix dies natalis, insulin, ceterum autem censeo ‘beta is better. Acta Diabetol. 2021;58:1287–1306. - PubMed
    1. Pepper A.R., Bruni A., Shapiro A.M.J. Clinical islet transplantation: Is the future finally now? Curr. Opin. Organ Transplant. 2018;23:428–439. doi: 10.1097/MOT.0000000000000546. Preprint at. - DOI - PubMed
    1. Pagliuca F.W., Millman J.R., Gürtler M., Segel M., Van Dervort A., Ryu J.H., Peterson Q.P., Greiner D., Melton D.A. Generation of functional human pancreatic β cells in vitro. Cell. 2014;159:428–439. - PMC - PubMed

MeSH terms