. 2025 Feb 8;11(1):12.
doi: 10.1038/s41523-025-00718-x.

Molecular characterization of pregnancy-associated breast cancer and insights on timing from GEICAM-EMBARCAM study

Affiliations

Molecular characterization of pregnancy-associated breast cancer and insights on timing from GEICAM-EMBARCAM study

Regina Peña-Enríquez et al. NPJ Breast Cancer. .

Abstract

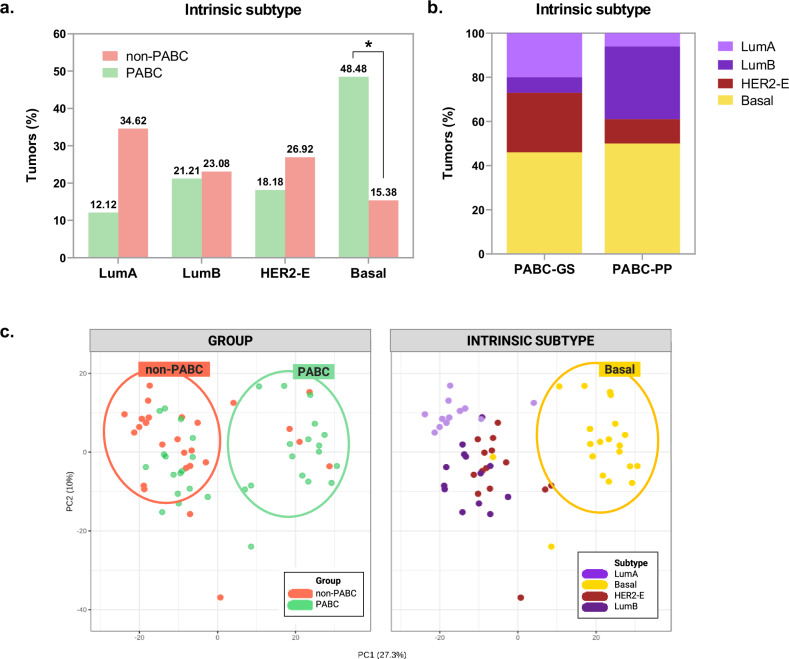
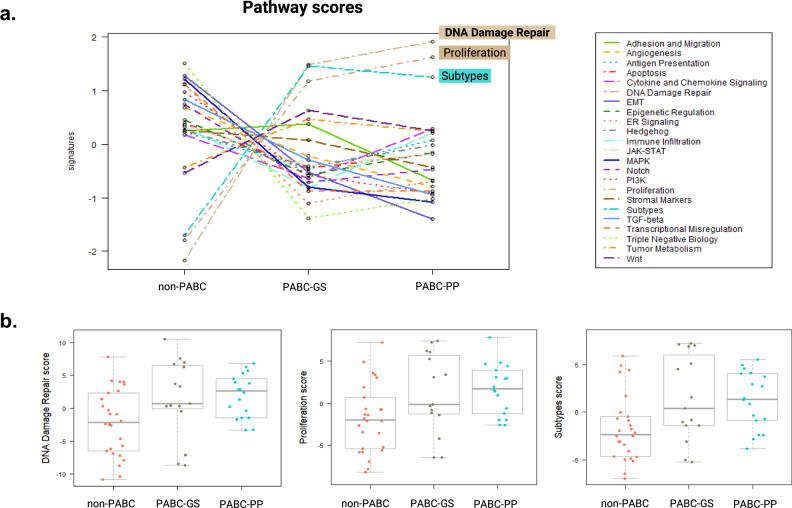
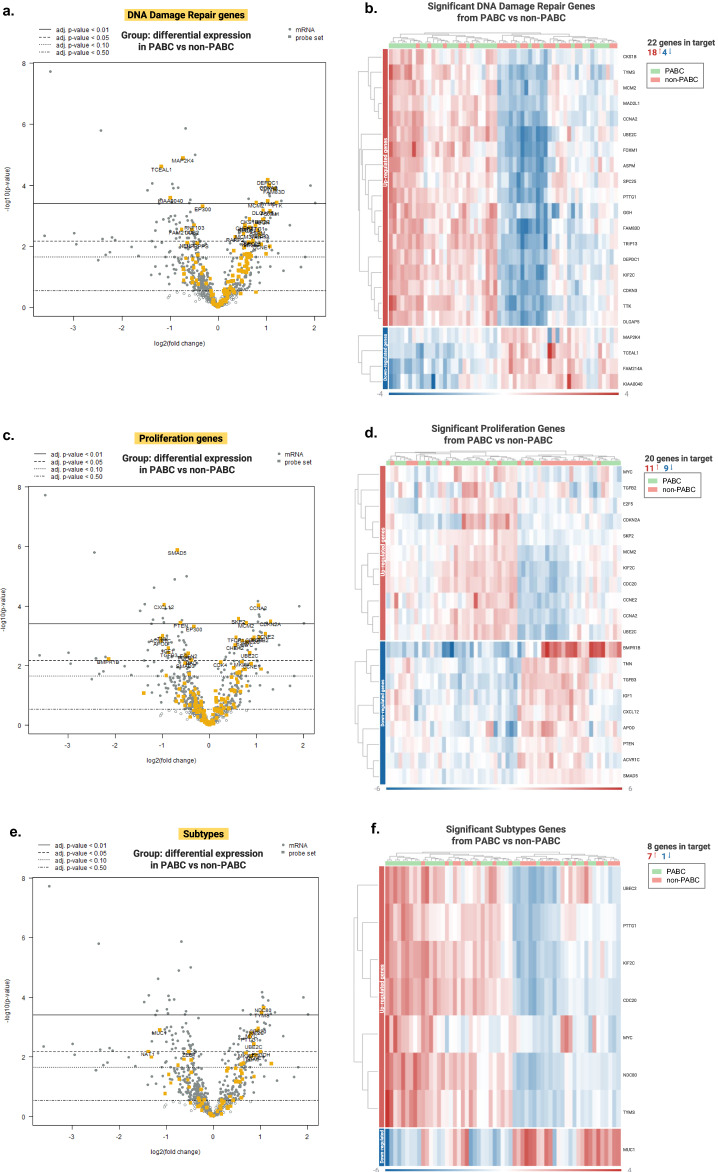
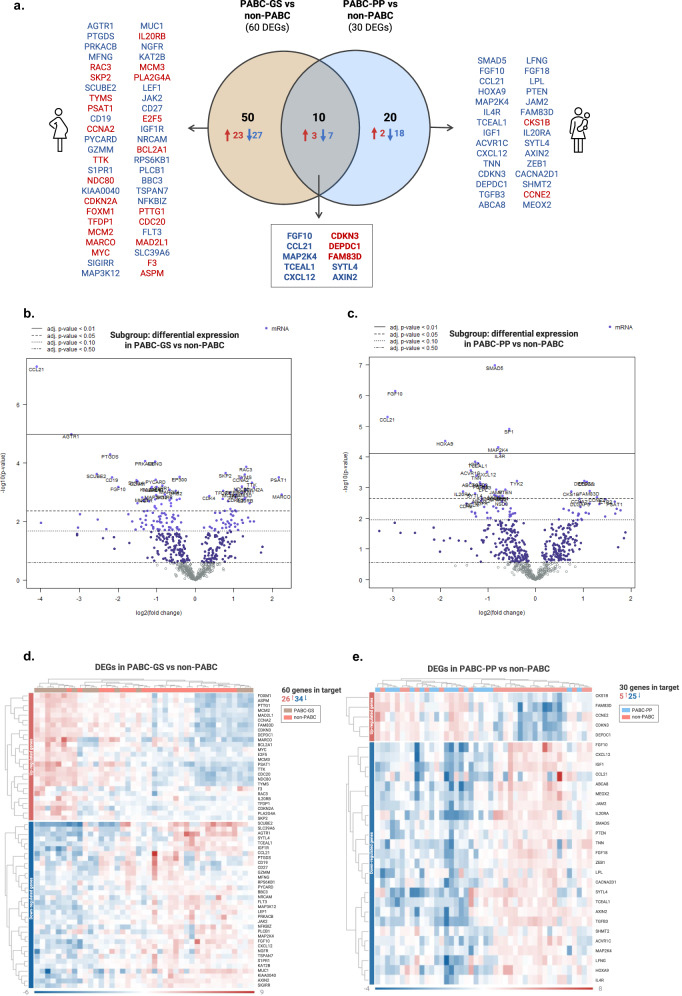
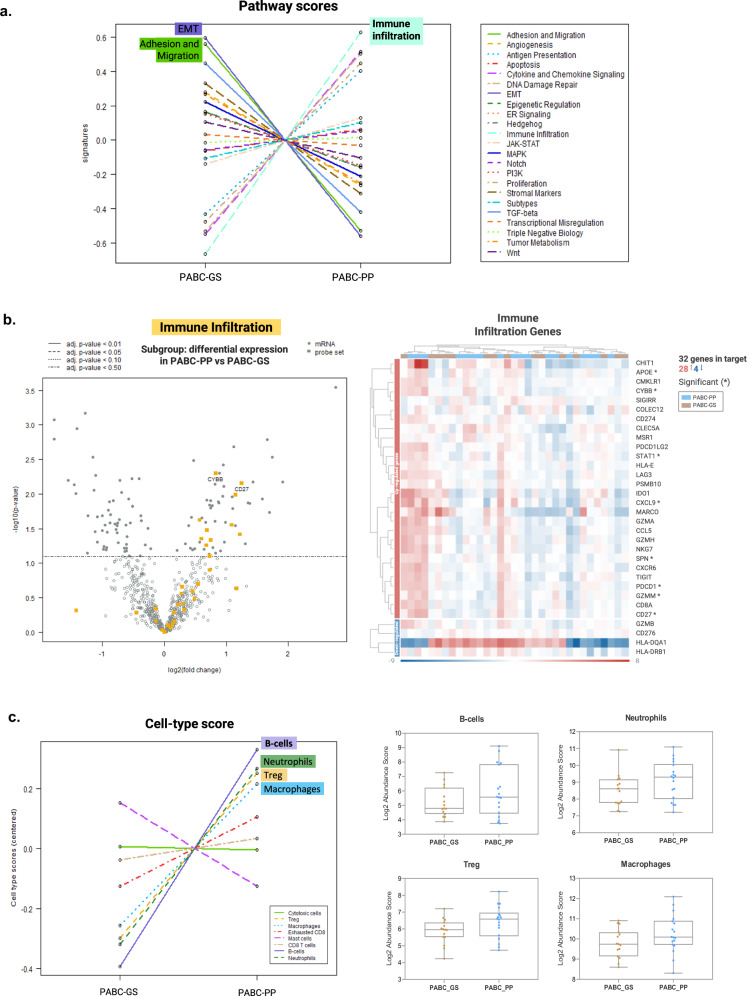
Pregnancy-associated breast cancer (PABC), diagnosed during or shortly after pregnancy, is a challenging entity with an aggressive biology and poor prognosis. This study analyzed the clinicopathological characteristics and gene expression profile of 33 PABC and 26 non-PABC patients using the nCounter BC360 Panel (NanoString). Notably, PABC showed a higher prevalence of basal-like tumors than non-PABC (48.48% vs 15.38%, p = 0.012) and displayed 73 differentially expressed genes (e.g., DEPDC1, CCNA2, PSAT1, CDKN3, and FAM83D), enriched in DNA repair and cell proliferation pathways. Through the PPI network, we also identified a cluster of cell-cycle regulation genes like MYC, FOXM1, or PTEN. Interestingly, differences emerged when comparing patients diagnosed during gestation (PABC-GS) and the postpartum period (PABC-PP), with PABC-PP showing increased expression of immune-related genes, including PD-1, and greater immune cell infiltration (Tregs, macrophages, neutrophils, B-cells). These findings suggest an enhanced proliferative capacity and impaired DNA repair in PABC, and underscore the role of immune infiltration in postpartum cases; providing insights into its aggressive nature and potential targets.


Conflict of interest statement

Competing interests: B.B. declares having received fees for medical education in a consulting or advisory role with Lilly, Pfizer, MSD, Pierr Fabre, Astra Zeneca, and Gilead; participated in a speakers’ bureau with Roche, MSD, Daichii, Sankio Astra Zeneca, Novartis, Lilly, Gilead, Seagen; travel accommodation by Pfizer and Gilead. Y.J.G. declares having received speakers´ honoraria from Roche, Novartis, Lilly, Daichii, and AstraZeneca; travel and training grants from Roche, Novartis, Pfizer, Daichii, Gilead, and Lilly. A.F.A. declares Honoraria or consultation fees from GSK, MSD, AstraZeneca, Pharma & Go, EISAI, Lilly, Pfizer, Novartis, and Pierre Fabre; travel/accommodation expenses from GSK, MSD, AstraZeneca, and Pfizer; speakers bureau participation with GSK, MSD, AstraZeneca, EISAI, Novartis and Pierre Fabre. F.M. declares consulting/advisory role with Novartis, Pfizer, AstraZeneca, MSD, Daiichi Sankyo, and Seagen; speakers’ bureau from Pfizer and Novartis; research funding from Pfizer; travel/accommodations expenses by Pfizer, Novartis and Gilead. M.H.L.-C. declares having received speaker honoraria from Daichii, Novartis & Pierre Fabre; and travel and training grants from Roche & Novartis. I.B. declares having research funding from Agendia, AstraZeneca, Lilly, Pfizer, and Roche; honoraria as a medical monitor from Medical Scientia Innovation Research (MEDSIR); honoraria and advisor collaboration from AstraZeneca, Bristol-Myers Squibb, Celgene, Daiichi-Sankyo, Eisai, Gilead, Grünenthal, GSK, Jazz Pharmaceutical, Lilly, MSD, Novartis, Pfizer, Pierre-Fabre, Roche, Seagen and Veracyte; travel and meeting attendance grants from AstraZeneca, Bristol-Myers Squibb, Daiichi-Sankyo, Gilead, Lilly, Novartis, Pfizer, Pierre-Fabre and Roche. A.G.-Z. declares institutional grant from Pfizer; advisory role honoraria from AstraZeneca, Novartis, MSD, Pierre-Fabre, Exact Science, Menarini-Stemline and Daichy Sankyo; travel grants from Roche, Novartis, Pfizer, Gilead and Pierre Fabre; speaker Bureau/Expert testimony with Roche, AstraZeneca, Daichi-Sankyo, Novartis, MSD, Pfizer and Menarini-Stemline. J.H.-R. declares having received research grants from Roche and Pfizer; consulting/advisory fees from AstraZeneca, Amgen, Roche/Genentech, Novartis, Eli Lilly, and Pfizer; speakers’ honoraria from AstraZeneca, Lilly, Amgen, Roche/Genentech, Novartis, and Pfizer. All remaining authors have declared no conflicts of interest.

Figures

Fig. 1
Fig. 1. Intrinsic subtypes classification of samples.
a Distribution of BC molecular subtypes in PABC and non-PABC groups of tumors using the PAM50 prediction algorithm. b Distribution of BC molecular subtypes in PABC-GS and PABC-PP subgroups of tumors. c Principal component analysis (PCA) of the gene expression data of samples, on the left classified by group (PABC and non-PABC), and on the right classified by intrinsic subtype (LumA, Basal-like, HER2-E, and LumB). *p-value < 0.05.
Fig. 2
Fig. 2. DEGs between PABC and non-PABC.
a Volcano plot showing the log10 (p-value) and log2 FC of the 776 genes from nCounter BC360™ Panel in PABC (n = 33) compared to non-PABC (n = 26). Several FDR thresholds were indicated by horizontal lines. b Heatmap for the 73 DEGs with |FC| ≥ 1.5 and FDR < 0.05 in PABC (red) and non-PABC (green) samples. The red through blue color indicates high to low expression levels. c Comparative box plots displaying the normalized expression levels of the top ten most significant DEGs (FDR < 0.01) for the 59 samples classified into patient subgroups (PABC-GS and PABC-PP) and control (non-PABC) (*FDR < 0.05; **FDR < 0.01; ***FDR < 0.001 compared with control). d STRING clustering analysis of the DEGs in PABC patients. Network represented the most significant DEGs in PABC (nodes, n = 73) and their interactions (edges, n = 306). Hub genes, nodes with a degree of connectivity ≥ 15, are listed in the table on the right. Genes involved in the cell cycle regulation process, according to gene ontology (GO) term enrichment analysis, are shown as red nodes.
Fig. 3
Fig. 3. PSA.
a Graph showing the average scores of the 23 biological pathways/processes from the nCounter BC360 panel according to the gene expression profile across patient (PABC-GS and PABC-PP) and control (non-PABC) samples. b Comparative box plots of pathways score for DNA damage repair, proliferation, and subtype signatures across patient (PABC-GS and PABC-PP) and control (non-PABC) samples.
Fig. 4
Fig. 4. DEGs for the most relevant signatures in PABC.
a Volcano plot of DE in PABC vs non-PABC with the DNA damage repair genes highlighted in orange. b Heat map for the most DEGs of the DNA damage repair signature (|FC| ≥ 1.5 and FDR < 0.05) in PABC (red) and non-PABC (green). c Volcano plot of DE in PABC vs non-PABC with the proliferation genes highlighted in orange. d Heat map for the most DEGs of the proliferation signature (|FC| ≥ 1.5 and FDR < 0.05) in PABC (red) and non-PABC (green). e Volcano plot of the DE in PABC vs non-PABC with the subtypes-related genes highlighted in orange. f Heat map for the most DEGs of the subtypes signature (|FC| ≥ 1.5 and FDR < 0.05) in PABC (red) and non-PABC (green).
Fig. 5
Fig. 5. Specific DEGs for each subgroup of PABC vs non-PABC tumors.
a Venn diagram displays the number of specific genes from each subgroup of PABC tumors (PABC-GS, brown; PABC-PP, blue) compared to tumors from controls (non-PABC). The intersection indicates the overlap of ten common genes in both subgroups. b Volcano plot of the DE in PABC-GS (n = 15) vs non-PABC (n = 26). c Heatmap for the 60 DEGs with an |FC| ≥ 1.5 and FDR < 0.05 in PABC-GS (blue) and non-PABC (green) samples. d Volcano plot of the DE in PABC-PP (n = 18) vs non-PABC (n = 26). e Heatmap for the 30 DEGs with an |FC| ≥ 1.5 and FDR < 0.05 in PABC-PP (blue) and non-PABC (green) samples.
Fig. 6
Fig. 6. DEGs between PABC-PP and PABC-GS.
a Volcano plot showing the log10 (p-value) and log2 FC of the 776 genes from the nCounter Breast Cancer 360 panel in PABC-PP (n = 18) compared to PABC-GS (n = 15). b Heatmap for the 71 DEGs with an |FC| ≥ 1.5 and p-value < 0.05 in PABC-PP (blue) and PABC-GS (brown) samples. The red through blue color indicates high to low expression levels. c Comparative box plots displaying the normalized expression levels of the top ten most significant DEGs (p-value < 0.01) for the 33 samples classified into subgroups (PABC-GS, PABC-PP). d STRING clustering analysis displays a network comprising the DEGs in PABC-PP vs PABC-GS (nodes, n = 71) and their interactions (edges, n = 238). Hub genes, nodes with a degree of connectivity ≥ 10, are listed in the table on the right. Genes involved in the immune response process, according to gene ontology (GO) term enrichment analysis, are shown as red nodes.
Fig. 7
Fig. 7. Pathway and cell-type profiling analysis between subgroups.
a Graph showing the average scores of the 23 biological pathways/processes from the nCounter BC360 panel according to the gene expression profile between PABC-GS and PABC-PP. b Volcano plot of the DE in PABC-PP vs PABC-GS with the immune infiltration genes highlighted in orange, and on the right a heat map for the 33 genes from the immune infiltration signature in PABC-PP (blue) and PABC-GS (brown), marking with an *those genes with a |FC| ≥ 1.5 and p-value < 0.05. c The graph shows immune cell-type abundance measurements across subgroups of patients (PABC-GS and PABC-PP), according to their gene expression profiles. Each cell type score was centered to zero value; on the right comparative box plot displayed the cell abundance score for the most enrichment cell types in PABC-PP compared to PABC-GS.

References

    1. Peccatori, F. A. et al. Cancer, pregnancy and fertility: ESMO clinical practice guidelines for diagnosis, treatment and follow-up. Ann.Oncol. 10.1093/ANNONC/MDT199 (2013). - PubMed
    1. Vinatier, E., Merlot, B., Poncelet, E., Collinet, P. & Vinatier, D. Breast cancer during pregnancy. Eur. J. Obstet. Gynecol. Reprod. Biol.147, 9–14 (2009). - PubMed
    1. Johansson, A. L. V. & Stensheim, H. Epidemiology of pregnancy-associated breast cancer. Adv. Exp. Med. Biol.1252, 75–79 (2020). - PubMed
    1. Amant, F. et al. The definition of pregnancy-associated breast cancer is outdated and should no longer be used. Lancet Oncol.22, 753 (2021). - PMC - PubMed
    1. Andersson, T. M. L., Johansson, A. L. V., Hsieh, C. C., Cnattingius, S. & Lambe, M. Increasing incidence of pregnancy-associated breast cancer in Sweden. Obstet. Gynecol.114, 568–572 (2009). - PubMed

LinkOut - more resources