. 2025 Feb 8;16(1):1470.
doi: 10.1038/s41467-025-56785-y.

R-loops acted on by RNase H1 influence DNA replication timing and genome stability in Leishmania

Affiliations

R-loops acted on by RNase H1 influence DNA replication timing and genome stability in Leishmania

Jeziel D Damasceno et al. Nat Commun. .

Abstract

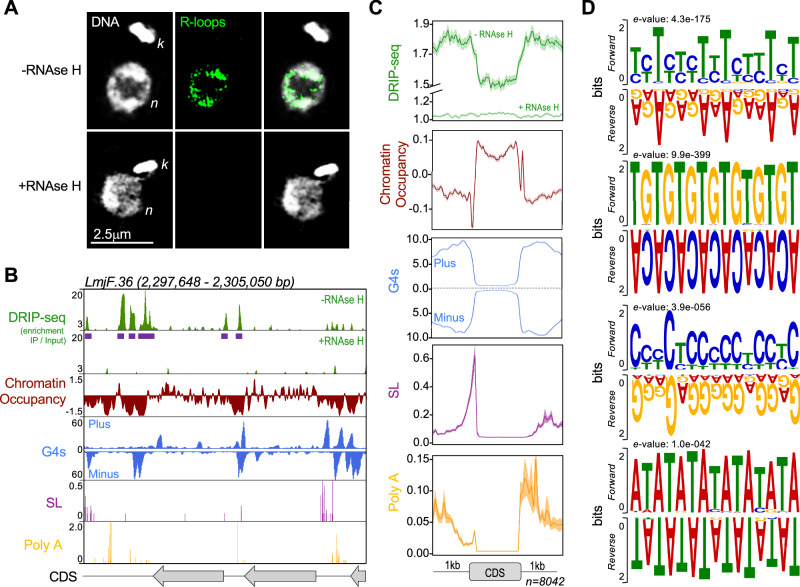
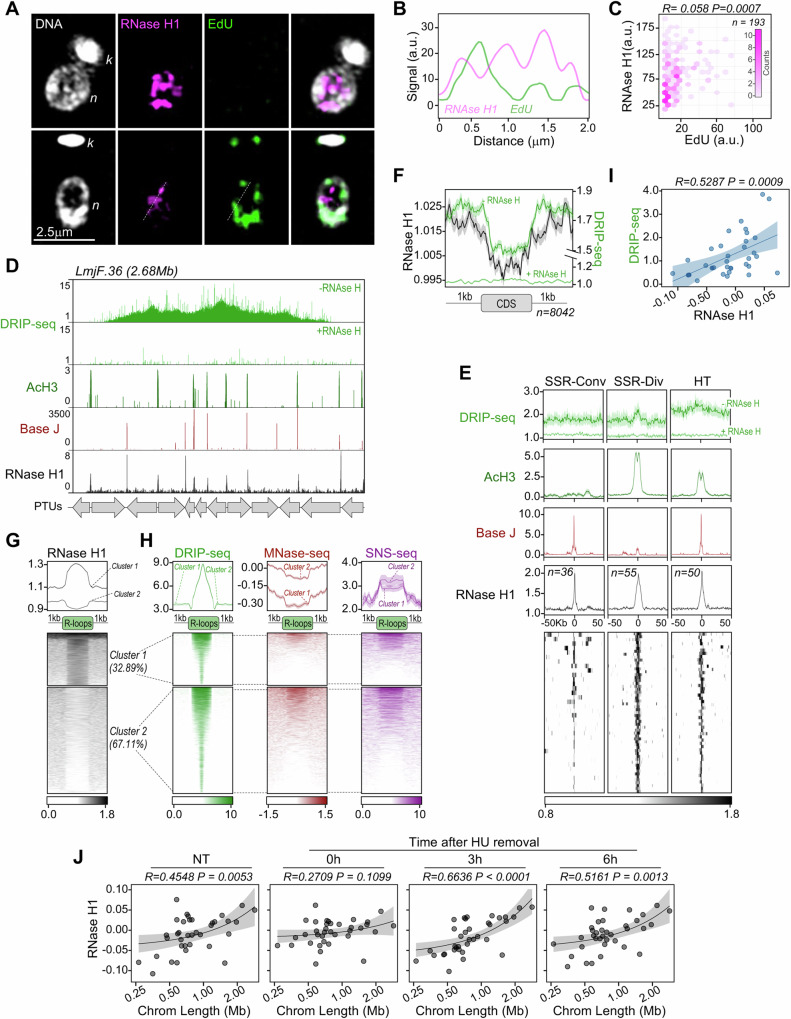
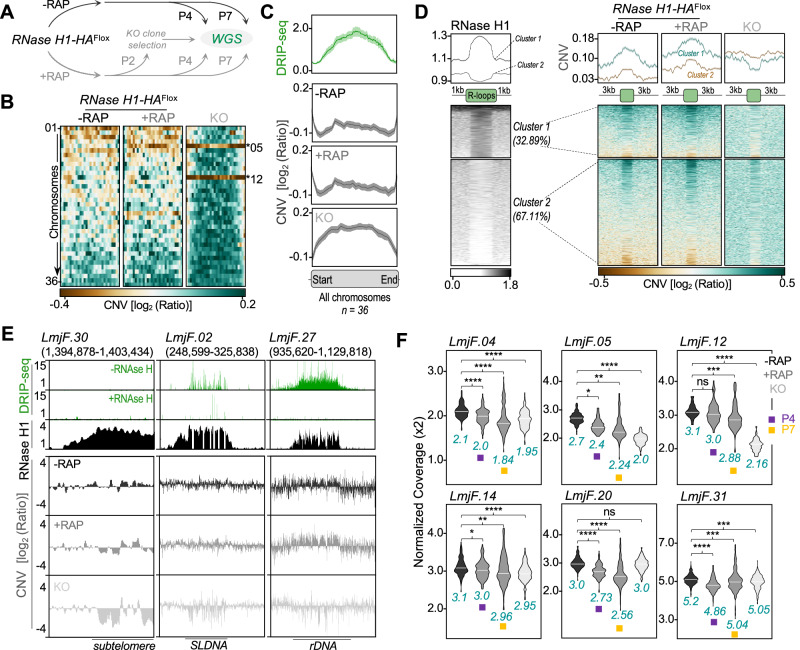
Genomes in eukaryotes normally undergo DNA replication in a choreographed temporal order, resulting in early and late replicating chromosome compartments. Leishmania, a human protozoan parasite, displays an unconventional DNA replication program in which the timing of DNA replication completion is chromosome size-dependent: larger chromosomes complete replication later then smaller ones. Here we show that both R-loops and RNase H1, a ribonuclease that resolves RNA-DNA hybrids, accumulate in Leishmania major chromosomes in a pattern that reflects their replication timing. Furthermore, we demonstrate that such differential organisation of R-loops, RNase H1 and DNA replication timing across the parasite's chromosomes correlates with size-dependent differences in chromatin accessibility, G quadruplex distribution and sequence content. Using conditional gene excision, we show that loss of RNase H1 leads to transient growth perturbation and permanently abrogates the differences in DNA replication timing across chromosomes, as well as altering levels of aneuploidy and increasing chromosome instability in a size-dependent manner. This work provides a link between R-loop homeostasis and DNA replication timing in a eukaryotic parasite and demonstrates that orchestration of DNA replication dictates levels of genome plasticity in Leishmania.


Conflict of interest statement

Competing interests: The authors declare no competing interests.

Figures

Fig. 1
Fig. 1. Subcellular localization and genome-wide mapping of R-loops in L. major.
A Immunofluorescence analysis to detect R-loops in wild type cells using S9.6 antibody; -RNase H and +RNase H indicate mock or treatment with recombinant RNase HI prior to incubation with antibody, respectively; n and k, nuclear and kinetoplast DNA, respectively; image is representative of three independent experiments. B Snapshot showing DRIP-seq signal relative to the indicated features in a representative genomic region; from top to bottom: track 1 and 2 (green), R-loop enriched regions relative to input material; R-loop peaks are indicated as purple horizontal bars below track 1; track 3 (dark red), chromatin accessibility as determined by MNase-seq; track 4 (blue), G quadruplex structures (G4s) as determined by G4-seq; track 5 (purple), splice leader (SL) acceptor sites as determined by RNA-seq; track 6 (yellow), polyadenylation (Poly A) acceptor sites as determined by RNA-seq; grey arrows at the bottom indicate annotated coding sequences (CDSs); further genomic regions are shown in Supplementary Fig. 3 and 4. C Metaplots showing global DRIP-seq signal around CDSs relative to chromatin accessibility, G4 localization, and SL and Poly A sites; lines indicate mean and shaded areas represent SEM. D Top enriched DNA sequences motifs found in R-loop peaks, as identified by MEME analysis; e-values for each motif are shown on top of each panel; forward and reverse indicate motifs sequences as given by top and bottom strand, respectively, of reference genome.
Fig. 2
Fig. 2. Chromosome-size dependent distribution of R-loops is reflected in a range of further genetic features.
A Colourmap showing distribution of DRIP-seq signal in all 36 L.major chromosomes; chromosomes are ordered by size; -RNase H and +RNase H indicate mock or treatment with recombinant RNase HI prior to immunoprecipitation, respectively; shuffled, indicates DRIP-seq signal plotted after R-loops peaks were randomly distributed throughout the genome; an independent experiment is shown in Supplementary Fig. 5. BG Colourmaps showing distribution patterns of DNA replication timing predicted by MFA-seq, putative origins of DNA replication (ORIs) predicted by SNS-seq, chromatin accessibility determined by MNase-seq, G-quadruplexes (G4s) density determined by G4-seq, distribution of directed and inverted short interspersed degenerate retroposons 1 (SIDER1) and GC fraction, respectively; chromosome 31, which does not follow the pattern of all other chromsomes for (A, C and D), is indicated. HN Simple linear regression analysis showing correlation between chromosome size and chromosome-averaged signals of DRIP-seq, DNA replication timing, ORIs, chromatin accessibility, G4s, SIDER1 sequences and GC fraction, respectively. OT Simple linear regression analysis showing correlation between averaged DRIP-seq signal at each chromosome and averaged signals of DNA replication timing, ORIs, chromatin accessibility, G4s and SIDER sequences, respectively. In panels H to T, R and P values are indicated at the top of each panel, circles indicate mean, lines indicate the best fit and shaded areas represent 95% CI. Source data are provided as a Source Data file.
Fig. 3
Fig. 3. Subcellular localization and genome wide mapping of RNase H1 in L. major.
A Immunofluorescence analysis to detect RNase H1-HA using anti-HA antibody; cells undergoing DNA replication are shown by EdU signal; n and k indicate nuclear and kinetoplast DNA, respectively; image is representative of two independent experiments. B Line scan, plotting the RNase H1-HA and EdU signal intensity values across the dotted white line in (A). C RNase H1-HA versus EdU signal intensity plotted as a 2D density plot using hexagonal bins; R and P values for linear regression analysis is shown at the top. D Representative snapshot of RNase H1-HA ChIP-seq; from top to bottom: track 1 and 2 (green), DRIP-seq signal where -RNase H and +RNase H indicate mock or treatment with recombinant RNase HI prior to immunoprecipitation, respectively; track 3 (dark green), enriched regions of acetylated Histone H3 (AcH3); track 4 (dark red), β-D-glucosyl-hydroxymethyluracil (Base J) enriched regions; track 5 (dark grey), RNase H1-HA enriched regions relative to input material; grey arrows at the bottom indicate the position and orientation of polycistronic transcription units (PTUs). E Metaplots (top) and colourmap (bottom) showing RNase H1-HA ChIP-seq signal around convergent, divergent and head-to-tail strand switch regions (SSR-Conv, SSR-Div and HT, respectively); metaplots for DRIP-seq, AcH3 and Base J are also shown; in metaplots above colourmaps, lines and shaded areas represent mean and SEM, respectively. F Metaplot showing global RNase H1-HA ChIP-seq signal (dark gray) around CDSs compared with DRIP-seq signal (green); lines indicate mean and shaded areas represent SEM. G Metaplots (top) and colourmap (bottom) showing RNase H1-HA ChIP-seq signal around DRIP-seq peaks; regions were grouped using k-means clustering; percentages indicate the proportion of peaks in each cluster. H DRIP-seq, MNase-seq and SNS-seq signals were plotted around DRIP-seq peaks grouped in clusters 1 and 2 from (G) and represented as metaplots (top) and colourmaps (bottom). In metaplots above colourmaps in (G and H), lines and shaded areas represent mean and SEM, respectively. I Simple linear regression analysis showing correlation between averaged signals of RNase H1-HA ChIP-seq and DRIP-seq at each chromosome. J Simple linear regression analysis showing correlation between chromosomes length and averaged signals of RNase H1-HA ChIP-seq at each chromosome in unperturbed exponentially growing cells (NT) and after release from synchronization with hydroxyurea (HU); cell cycle progression analysis upon HU synchronization is shown in Supplementary Fig. 14A. In panels I and J, R and P values are indicated at the top of each panel, circles indicate mean, lines indicate the best fit and shaded areas represent 95% CI. Source data are provided as a Source Data file.
Fig. 4
Fig. 4. Effects of RNase H1 loss on growth, R-loop accumulation and DNA replication timing.
A Schematic representation of the DiCre-mediated RNase H1 gene deletion strategy; CRISPR-Cas9 was used to flank the RNase H1 ORF with LoxP sites and fuse it with an HA tag (RNase H1-HAFlox); rapamycin-mediated activation of DiCre was used to catalyze excision of RNase H1-HAFlox; refer to Supplementary Fig. 10 for the rapamycin induction strategy; a and b, annealing position of primers used in (D). B Western blotting analysis of whole cell extracts from RNase H1-HAFlox cells ~48 h after growth in the absence (−RAP) or in the presence (+RAP) of rapamycin at passages 1 and 2 (P1 and P2, as shown in (C)); extracts were probed with anti-HA antibody and anti-EF1α was used as loading control. C Growth profile of the RNase H1-HAFlox cell line cultivated in the absence (−RAP, black) or presence (+RAP, grey) of rapamycin; cells were seeded at ~105 cells.mL−1 at day 0 and diluted back to that density every 4–5 days for seven passages (P1 to P7); cell density was assessed every 24 h in two independent experiments. D PCR analysis of genomic DNA extracted from RNase H1-HAFlox cells ~48 h in the indicated passages, after growth in the absence (−RAP) or in the presence (+RAP) of rapamycin; annealing positions for primers a and b are shown in (A); image is representative of two independent experiments. E Growth profile of a clonal RNase H1 KO cell line, selected after DiCre-mediated RNase H1 gene deletion compared to wild type (WT) cells; cell density was assessed every 24 h and is represented as the mean from four independent experiments; error bars indicate SEM. F Immunofluorescence analysis using S9.6 antibody to detect R-loops with (+HU) or without (−HU) 5 mM hydroxyurea treatment for 6 h. G Quantification of R-loops levels detected via immunofluorescence using S6.9 antibody in the indicated conditions, represented as arbitrary units (arb. units); −RNase H and +RNase H indicate mock or treatment with recombinant RNAse HI prior to incubation with antibody, respectively; quantification is representative of three independent experiments; (****),(**) and ns: p < 0.0001, p = 0.0089 and not significant, respectively, as determined by Kruskal–Wallis test (one-way ANOVA) using Dunn’s test for multiple comparison correction. H Representative snapshot showing DNA replication timing on the entire chromosome 22, as determined by MFA-seq using exponentially growing cells normalized with stationary cells; positive and negative values indicate early and late replicating regions, respectively; grey arrows at the bottom indicate the position and orientation of polycistronic transcription units (PTUs). I, J Metaplots showing global MFA-seq signal in early and late replicating regions, respectively; lines indicate mean and shaded areas represent SEM; (****),(**), (*) and ns: p < 0.0001, p = 0.0054, p = 0.0188 and not significant, respectively, as determined by Kruskal–Wallis test (one-way ANOVA) using Dunn’s test for multiple comparison correction. K Simple linear regression analysis showing correlation between chromosome size and averaged MFA-seq signal; R and P values are indicated at the top of each panel, circles indicate mean, lines indicate the best fit and shaded areas represent 95% CI. Source data are provided as a Source Data file.
Fig. 5
Fig. 5. Analysis of CNV events upon DiCre-mediated RNase H1 gene deletion.
A Schematic representation showing time points from which cells were collected for whole genome sequencing (WGS). B Colourmap showing genome-wide relative copy number variation (CNV) analysis; chromosomes are ordered by size from top to bottom; CNV in RNase H1-HAFlox cells is expressed as log2[ratio(normalized reads from P7/normalized reads from P4)] for either –RAP or +RAP conditions; CNV in KO cell line is expressed as log2 [ratio(normalized reads from KO/ normalized reads from P4 -RAP)]; chromosomes 05 and 12, showing decreased copy number, are indicated. C Metaplots showing averaged CNV profiles across all chromosomes (grey); averaged DRIP-seq profiles across all chromosomes from 2A is also shown at the top (green). D Metaplots (top) and colourmap (bottom) showing relative CNV profiles around DRIP-seq peaks upon k-means clustering from 3G. In metaplots from C and D, lines indicate mean and shaded areas represent SEM. E Relative CNV analysis at the indicated loci; CNV is expressed as in (B); DRIP-seq (green) and RNase H1-HA ChIP-seq (black) signals are also shown at the top. F Absolute chromosome CNV analysis for the indicated chromosomes in the indicated conditions and passages; violin plots represent the distribution of normalized read counts relative to the haploid genome content; (****),(***) and (*): p < 0.0001, p = 0.0005 and p = 0.0141, respectively, as determined by Kruskal-Wallis test (one-way ANOVA) using Dunn’s test for multiple comparison correction. Source data are provided as a Source Data file.
Fig. 6
Fig. 6. Analysis of SNPs and InDels events upon DiCre-mediated RNase H1 gene deletion.
A, D Metaplots (top) and colourmaps (bottom) showing normalized density of new SNPs and InDels, respectively, around annotated coding sequences (CDSs). B, E Metaplots (top) and colourmaps (bottom) showing normalized density of new SNPs and InDels, respectively, around DRIP-seq peaks; regions were grouped using k-means clustering; percentages indicate the proportion of peaks in each cluster. C, F Metaplots of DRIP-seq, RNase H1-HA ChIP-seq, MNase-seq and SNS-seq signals around DRIP-seq peaks grouped in clusters 1, 2 and 3 from B and E, respectively. In metaplots from (A to F), lines indicate mean and shaded areas represent SEM. G, H SNP and InDel densities in chromosomes grouped by length; smaller: 0.268–0.622 Mb, medium: 0.629–0.840 Mb, larger: 0.913–2.68 Mb; (****), (***), (**), (*) and ns: p < 0.0001, p = 0.0001, p = 0.0012, p = 0.0155 and not significant, respectively, as determined by one-way ANOVA and Fisher’s LSD test. Source data are provided as a Source Data file.

References

    1. Hu, Y. & Stillman, B. Origins of DNA replication in eukaryotes. Mol. cell83, 352–372 (2023). - PMC - PubMed
    1. Costa, A. & Diffley, J. F. X. The initiation of eukaryotic DNA replication. Annu. Rev. Biochem.91, 107–131 (2022). - PubMed
    1. Lee, C. S. K., Weibeta, M. & Hamperl, S. Where and when to start: regulating DNA replication origin activity in eukaryotic genomes. Nucleus14, 2229642 (2023). - PMC - PubMed
    1. Chen, N. & Buonomo, S. C. B. Three-dimensional nuclear organisation and the DNA replication timing program. Curr. Opin. Struct. Biol.83, 102704 (2023). - PubMed
    1. Vouzas, A. E. & Gilbert, D. M. Mammalian DNA replication timing. Cold Spring Harb. Perspect. Biol.13, a040162 (2021). - PMC - PubMed

LinkOut - more resources