. 2025 Feb 8;8(1):202.
doi: 10.1038/s42003-025-07645-4.

TEFM facilitates transition from RNA synthesis to DNA synthesis at H-strand replication origin of mtDNA

Affiliations

TEFM facilitates transition from RNA synthesis to DNA synthesis at H-strand replication origin of mtDNA

Shigeru Matsuda et al. Commun Biol. .

Abstract

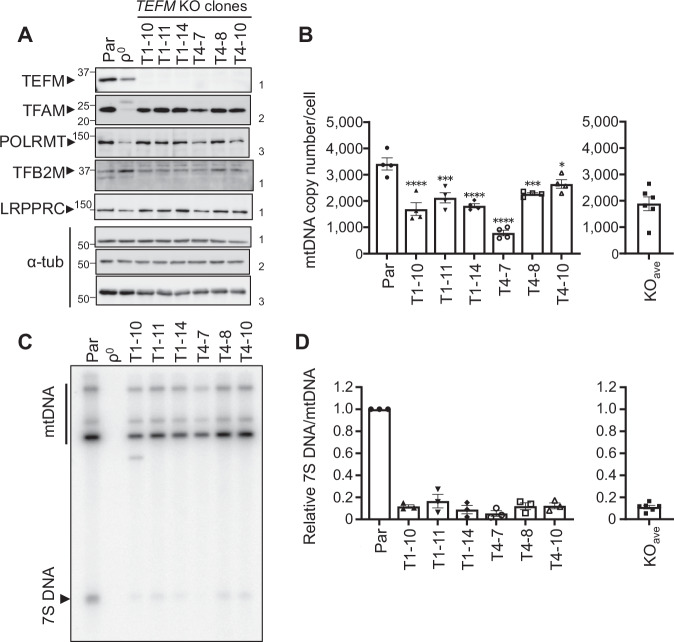
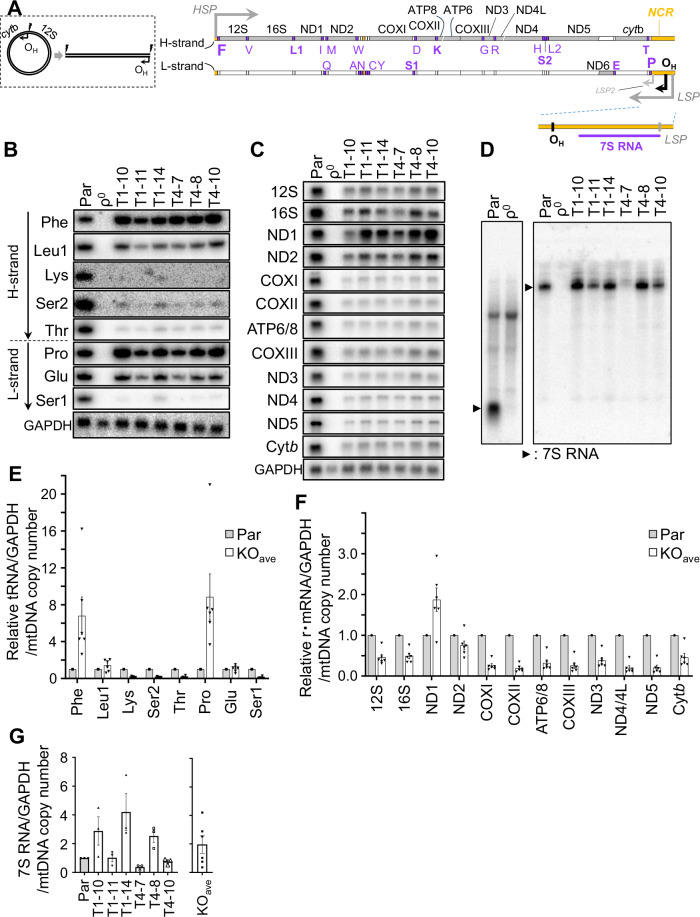
Transcription of human mitochondrial DNA (mtDNA) begins from specific transcription promoters. In strand-asynchronous mtDNA replication, transcripts from the light-strand promoter serve as primers for leading-strand synthesis at the origin of the H-strand replication (OH). A 7S DNA strand, a presumed aborted replication product, is also synthesized from OH. Transition from RNA synthesis to DNA synthesis at OH is crucial for balancing replication with transcription, yet the mechanism remains unclear. Herein, we examine the role of mitochondrial transcription elongation factor (TEFM) in this process. TEFM knockout results in decreased 7S DNA, strand-asynchronous replication intermediates, and mtDNA copy number, all of which are concordant with downregulation of RNA-to-DNA transition at OH. Conversely, levels of tRNAs encoded near transcription promoters increase, indicating enhanced transcription initiation frequency. Taken together, we propose that, in addition to conferring processivity to the mitochondrial RNA polymerase, TEFM plays a crucial role in maintaining the balance between mitochondrial transcription and replication.


Conflict of interest statement

Competing interests: The authors declare the following competing interests: T.Y. receives research funding through his institution from Renee Medical Corporation. The other authors declare no competing interests.

Figures

Fig. 1
Fig. 1. 7S DNA amount and mtDNA copy number are decreased in TEFM knockout clones.
A Western blot analysis of mitochondrial proteins using total cellular lysates of parental HeLa cybrid cells (Par), HeLa ρ0 cells (ρ0), and TEFM knockout (KO) clones. Each KO clone is designated by a number format “xy” with “T” at the beginning, where x corresponds to the guide RNA (gRNA) number used for genome editing of the TEFM gene, and y is the unique clone number. α-Tubulin (α-tub) served as a loading control. Gel panels were labeled with numbers 1–3 on the right side, and panels with the same number were produced from the same gels. Approximate positions of molecular size markers (kDa) are indicated on the left side. B Quantitative PCR (qPCR) analysis of mtDNA copy number. The graph represents the average from four independent preparations of parental and KO cells with SEM. *p < 0.05, ***p < 0.001, and ****p < 0.0001 by Dunnett’s test (Par vs. KO clones; two-sided). The averaged copy number of the six KO clones is denoted as KOave with SEM. C Examination of 7S DNA by one-dimensional agarose gel electrophoresis and Southern hybridization. Bands corresponding to 7S DNA and mtDNA are marked by an arrowhead and a vertical line, respectively. D Quantitative analysis of 7S DNA. Three independent sets of total nucleic acid fractions were prepared and analyzed twice. The intensity of 7S DNA bands was divided by the combined intensities of mtDNA bands. For each set, the value of parental cells was normalized to 1, and those of KO clones were expressed relative to this. The graph presents the average of results from the three sets with SEM. The mean of the averaged results of the six KO clones is displayed as KOave with SEM.
Fig. 2
Fig. 2. TEFM KO affects the patterns of mtDNA replication intermediates.
A Analysis of DraI-digested mtDNA with neutral-neutral two-dimensional agarose gel electrophoresis (2D-AGE) and Southern hybridization. Mitochondrial nucleic acids from parental cells (Par) and the six TEFM KO clones underwent 2D-AGE. A hybridization probe targeting a Dra I-digested fragment spanning from nt 12,271 to nt 16,010 detected mtDNA replication intermediates and nonreplicating fragments (1N). mtDNA with Dra I restriction sites and OH are schematically presented. A gray line on mtDNA indicates the position of the hybridization probe used for 2D-AGE experiments. A schematic representation of the 2D-AGE patterns is also provided, where i and ii are explained in the text. B Quantitative evaluation of mtDNA replication intermediates. Signal intensities of parts of arcs i and ii, approximately indicated by dotted blue lines in the drawing in (A), were quantified and the value from arc i was divided by that from arc ii and presented. Two independently prepared samples were analyzed, except for T4-7 with three independent samples. The average of the six KO clones with SEM is shown on the right.
Fig. 3
Fig. 3. Mitochondrial RNA expression levels are substantially changed in TEFM KO clones.
A A linearized mtDNA map split between the light- and heavy-strand promoters (LSP and HSP). Subunits of NADH-ubiquinone oxidoreductase (ND1, 2, 3, 4, 4L, 5, and 6), a subunit of ubiquinone-cytochrome c oxidoreductase (cytochrome b [cyt b]), subunits of cytochrome c oxidase (COXI, II, and III), subunits of ATP synthase (ATP6 and 8), mitochondrial rRNA genes (12S rRNA [12S] and 16S rRNA [16S]), and mitochondrial tRNA genes indicated by their cognate amino acids with single letter notation. The L- and H-strand transcription start sites (gray arrows) are labeled with LSP and HSP, respectively, on each strand in the major noncoding region (NCR; in yellow). OH and a recently reported second LSP, LSP2, are also indicated. The approximate position of 7S RNA is shown with a purple line in the enlarged drawing of a part of the NCR. Northern hybridization of mtDNA-encoded tRNAs (B), rRNAs, and mRNAs (C). tRNAs are denoted by their cognate amino acids. GAPDH mRNA (GAPDH) served as a loading control. D, E Quantitation of mitochondrial transcripts. Three independent total RNA preparations from parental cells and TEFM KO clones were analyzed twice with Northern hybridization and quantified. Mitochondrial transcript levels were normalized against GAPDH mRNA levels. For each preparation, the normalized levels of parental cell transcripts were set as 1 and those of the KO clones were expressed relative to this. The results from three independent preparations were averaged with SEM. The averaged values were divided by the relative mtDNA copy number and shown in Supplementary Fig. 3E, F (the parental cell mtDNA copy number was set as 1 and those of the KO clones were expressed relative to this based on Fig. 1B). Subsequently, the relative mitochondrial transcript levels (RNA/GAPDH mRNA/mtDNA copy number) from the six KO clones were averaged for each transcript with SEM and presented here as KOave. F Left panel: 7S RNA detection using agarose gel electrophoresis. Total RNAs from parental cells (Par) and ρ0 cells (ρ0) were electrophoresed and subjected to Northern hybridization. Right panel: 7S RNA detection in parental cells, ρ0 cells, and TEFM KO clones. Total RNA was fractionated by polyacrylamide gel electrophoresis (PAGE) and 7S RNA was visualized with Northern hybridization (arrowheads). G Quantitation of 7S RNA. Total RNA prepared from three independently cultured sample sets was analyzed by PAGE and Northern hybridization. 7S RNA levels were normalized to GAPDH mRNA levels. For each preparation of parental and TEFM KO cells, the normalized 7S RNA levels of parental cells were set as 1, and those from the rest were calculated relative to this. The results from three preparations were averaged with SEM, and the mean values with SEM were divided by the relative mtDNA copy number (the parental cell mtDNA copy number was set as 1, and those of the KO clones were expressed relative to this according to Fig. 1B) and shown. The mean of the averaged values from the six KO clones is also presented as KOave with SEM.
Fig. 4
Fig. 4. Complex I, III, and IV subunits, but not DNA polymerase γ, are depleted in TEFM KO cells.
Western blot analysis of proteins for the oxidative phosphorylation system (A) and DNA polymerase γ catalytic subunit POLGα and accessory subunit POLGβ (B) using total cellular lysates. α-tub served as a loading control. Two bands for POLGα were observed (the upper band, U; the lower band, L). Each gel panel is labeled with numbers 1–4 on the right side. Panels with the same number were derived from the same gels. Panels for α-tub 1–3 are identical to those in Fig. 1A. C Quantitation of POLGα, POLGα (L), and POLGβ. Western blot bands with three independent preparations of total cellular lysates were quantified. POLGα includes both U and L bands. Band intensities of POLG proteins were normalized with those of α-tub and divided by the relative mtDNA copy number (the parental cell mtDNA copy number was set as 1 and those of the KO clones were expressed relative to this based on Fig. 1B). For each preparation, POLG proteins/α-tub/mtDNA copy number in parental cells were set as 1, and those of the KO clones were expressed relative to this. The graph shows the average of three preparations with SEM. The means of the averaged results of the six KO clones are displayed as KOave with SEM on the right side.
Fig. 5
Fig. 5. Exogenous TEFM expression in T4-7 TEFM KO clone rescues the KO phenotype.
A Confirmation of HA-tagged TEFM expression (TEFM-HA) by Western blotting. A TEFM KO clone, T4-7, was transfected with a plasmid carrying a TEFM-HA construct, resulting in the generation of a T4-7R clone constitutively expressing TEFM-HA. A band corresponding to TEFM-HA was detected in T4-7R using anti-TEFM antibodies and anti-HA antibodies. α-tub was served as a loading control. B Western blot analysis of COX proteins, POLRMT, and TFAM. C qPCR analysis of the relative mtDNA copy number. The graph represents the averaged results from three independent preparations with SEM. **p < 0.01, ***p < 0.001, and n.s. (statistically not significant) by Dunnett’s test (two-sided). D Analysis of 7S DNA levels. Total nucleic acids from three independent preparations were used, and 7S DNA and mtDNA were visualized with Southern hybridization. Bands corresponding to them were quantified, and 7S DNA/mtDNA value from one of the Par preparations was set as 1, with all others expressed relative to this. The averaged value of each cell line was calculated with SEM and shown in the graph. *p < 0.05 by Dunnett’s test (two-sided). E 2D-AGE analysis of DraI-digested mtDNA replication intermediates using mitochondrial nucleic acids from T4-7R cells. The T4-7 panel in Fig. 2 is included here for comparison.
Fig. 6
Fig. 6. DNA polymerase γ catalytic and accessory subunits are co-immunoprecipitated with TEFM.
AC Analysis of anti-HA antibody-directed co-immunoprecipitation (Co-IP) samples, including input (Input), supernatant (Sup), and eluates (Elu), from T4-7R and parental (Par) cells. Western blotting was performed using antibodies against HA, TEFM (A), POLRMT (B), POLGα, and POLGβ (C). To ensure bands of comparable intensities in each panel, higher amounts were loaded in Elu lanes. Numbers in parentheses indicate the relative fold difference in the loading amounts of Elu samples to those of the corresponding Input and Sup samples. TEFM-HA and TEFM are denoted by black and gray arrowheads, respectively in (A). Arrowheads in (B) and (C) indicate the target protein bands. D Quantitative analysis of Co-IP efficiencies of POLRMT, POLGα, and POLGβ. The corresponding bands in Input and Elu lanes were quantified, and the Co-IP efficiencies were calculated as Input/Elu (%) with adjustments for loading amount differences. The graphs represent the average of five independent Co-IP experiments (Supplementary Fig. 7) with SEM. ***p < 0.01; ****p < 0.001 by t-test (two-sided).
Fig. 7
Fig. 7. Prolonged inhibition of mitochondrial translation by chloramphenicol does not enhance transcription initiation frequency but reduces 7S DNA levels.
Parental HeLa cybrid cells were cultured for eight weeks without (0) or with chloramphenicol (CAP; 10, 50, and 100 µg/ml) and harvested for analyses. A Western blot analysis of COXI, COXII, TEFM, and TFAM levels. α-tub served as a loading control. Northern hybridization analysis of mitochondrial rRNAs, mRNAs (B), and tRNAs (C). tRNAs are indicated by their cognate amino acids. GAPDH mRNA (GAPDH) served as a loading control. D Quantitation of rRNAs and mRNAs. Total RNA prepared from two independent 8-week-culture samples was analyzed. Mitochondrial transcript levels were normalized with GAPDH levels. For each preparation, the normalized levels of mitochondrial transcripts from cells cultured without CAP were set as 1, and those from the remaining samples were expressed relative to this. The results from the two preparations were averaged, divided by the relative mtDNA copy number (mtDNA copy number in cells without CAP treatment was set as 1 and those of the rests were expressed relative to this based on Fig. 7G) and shown. E Quantitation of tRNAs from three independent 8-week culture sample sets. Data processing is same as in (D), except that the error bars represent SEM. F 7S RNA detection in parental cells cultured without or with CAP for eight weeks. Total RNA was fractionated by PAGE and 7S RNA was visualized with Northern hybridization. Analysis of 7S RNA levels is shown in the graph. Total RNA prepared from three independently cultured sample sets was analyzed. 7S RNA levels were normalized to GAPDH levels. For each preparation of parental cells cultured without or with CAP for eight weeks, the normalized 7S RNA levels from untreated cells were expressed as 1, and those from the rest were calculated relative to this. Then, the results from the three preparations were averaged with SEM, and the mean values with SEM were divided by the relative mtDNA copy number (Fig. 7G) and shown. G mtDNA copy number analysis via qPCR with three independent 8-week incubation samples. For each set, mtDNA copy number of cells without CAP treatment was arbitrary set as 1, and the rest were expressed relative to this. The graph presents the average of the results from the three sets with SEM. H Analysis of 7S DNA levels. Total nucleic acid fractions were prepared from three independent 8-week culture sample sets and subjected to Southern hybridization. 7S DNA band intensity was divided by the combined intensities of mtDNA bands, and for each set, the value of CAP-untreated cells was set as 1, and the rest were expressed relative to this. The graph shows the average of the results from three sets with SEM, along with a hybridization image.
Fig. 8
Fig. 8. An in vivo model for TEFM involvement in RNA–DNA transition.
A Under normal conditions, TEFM promotes RNA–DNA transition at OH presumably by interacting with POLG. Balance is properly coordinated between transcription and priming. B In the absence of TEFM, the RNA–DNA transition is compromised, resulting in diminished 7S DNA and SAR intermediates. The increase of OH-proximal tRNA and decrease of RNA–DNA transition in the KO cells support an idea that TEFM serves as an RNA–DNA transition-promoting factor in vivo. We speculate that the loss of TEFM–POLG interaction contributes to the downregulation of the transition. Additionally, TEFM KO cells show depletion of mitochondrial translation products, which likely causes severe OXPHOS defect. Considering the data from mitochondrial translation inhibition experiments, it is possible that the translation defect in the KO cells has negative influence on the RNA–DNA transition.

References

    1. Anderson, S. et al. Sequence and organization of the human mitochondrial genome. Nature290, 457–465 (1981). - PubMed
    1. Yasukawa, T. & Kang, D. An overview of mammalian mitochondrial DNA replication mechanisms. J. Biochem.164, 183–193 (2018). - PMC - PubMed
    1. Magnusson, J., Orth, M., Lestienne, P. & Taanman, J. W. Replication of mitochondrial DNA occurs throughout the mitochondria of cultured human cells. Exp. Cell. Res.289, 133–142 (2003). - PubMed
    1. Ylikallio, E., Tyynismaa, H., Tsutsui, H., Ide, T. & Suomalainen, A. High mitochondrial DNA copy number has detrimental effects in mice. Hum. Mol. Genet.19, 2695–2705 (2010). - PubMed
    1. Mercer, T. R. et al. The human mitochondrial transcriptome. Cell146, 645–658 (2011). - PMC - PubMed

MeSH terms

LinkOut - more resources