. 2025 Feb 8;8(1):201.
doi: 10.1038/s42003-025-07627-6.

Densely vascularized thick 3D tissue shows enhanced protein secretion constructed with intermittent positive pressure

Affiliations

Densely vascularized thick 3D tissue shows enhanced protein secretion constructed with intermittent positive pressure

Misako Katsuura et al. Commun Biol. .

Erratum in

Abstract

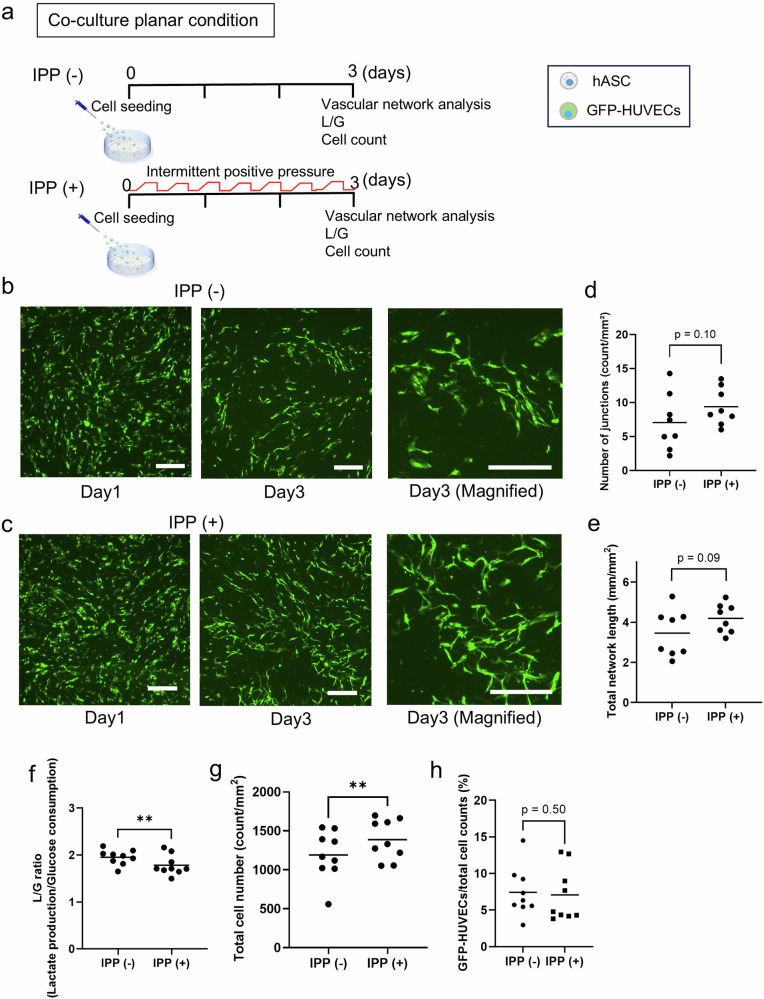
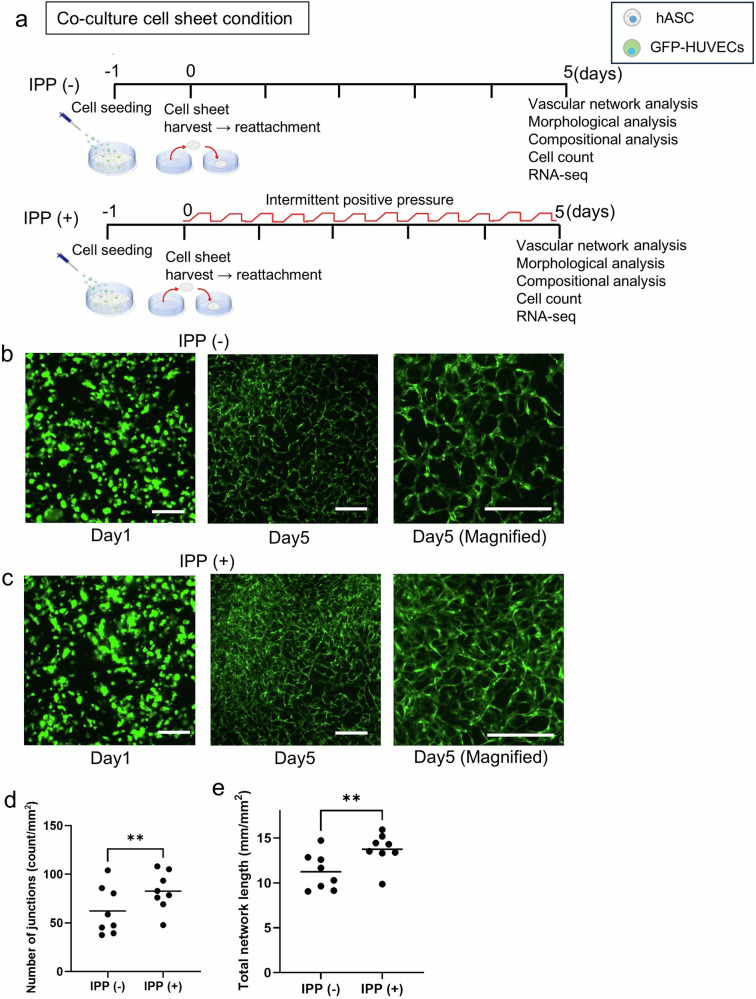
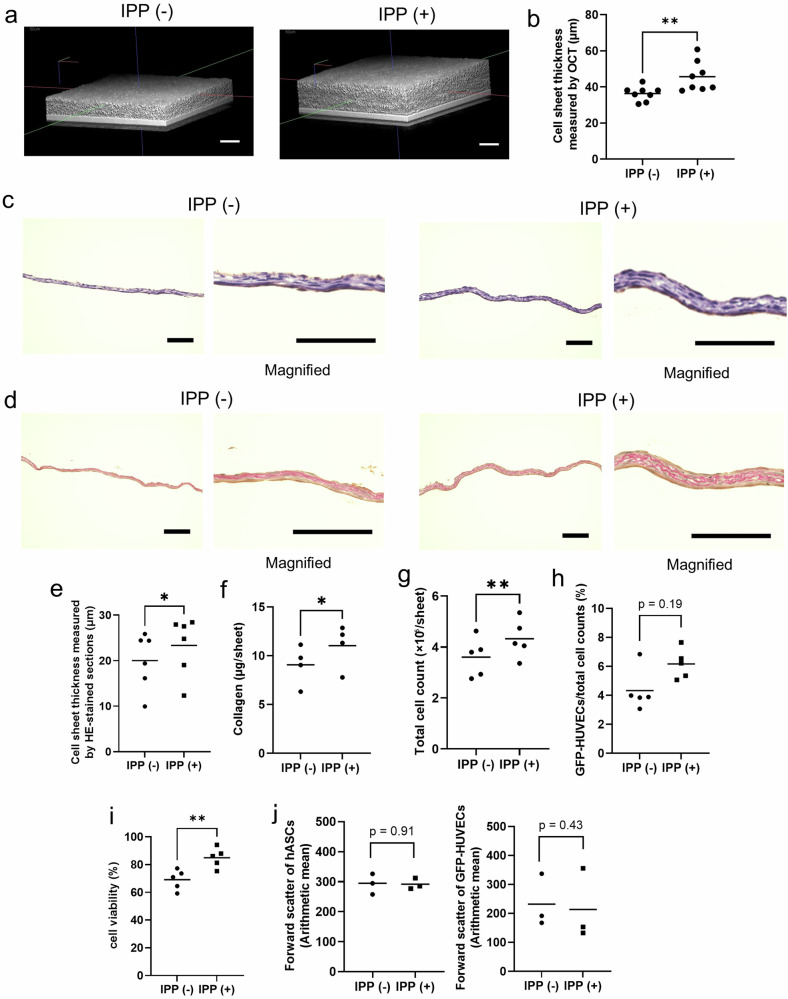
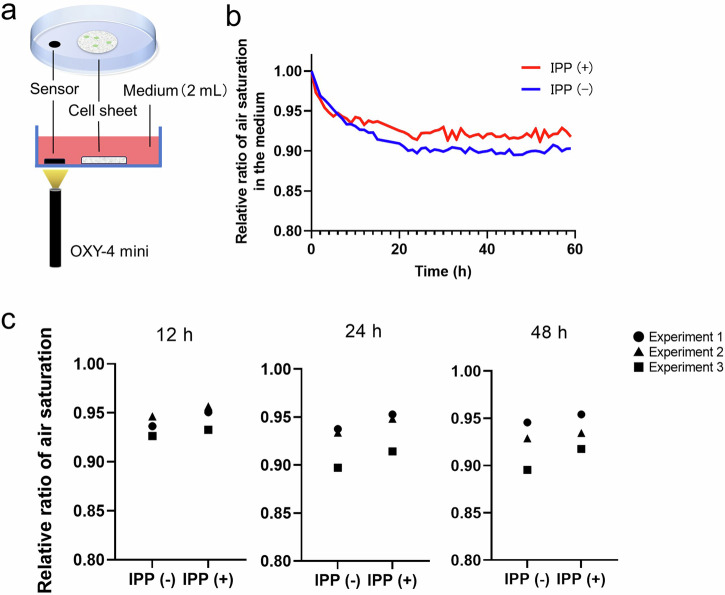
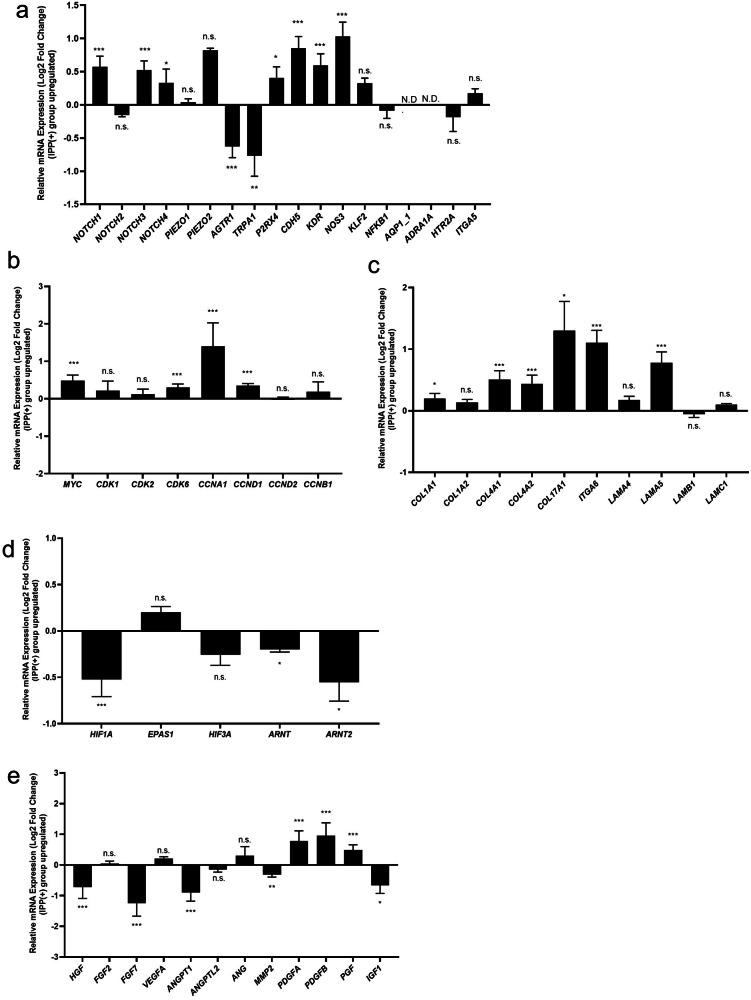
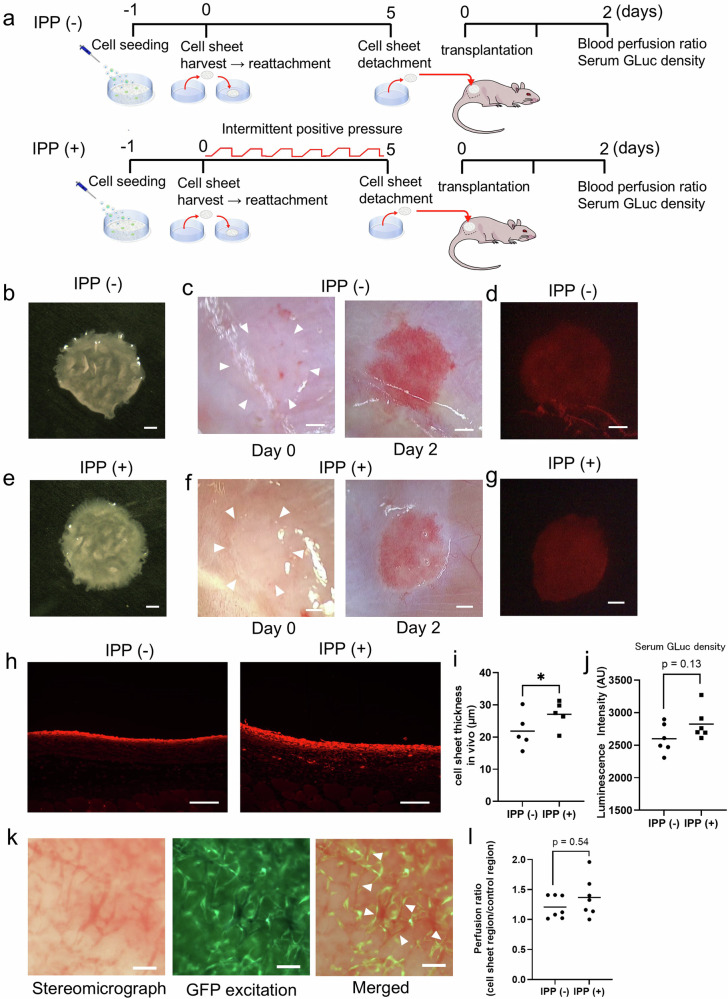
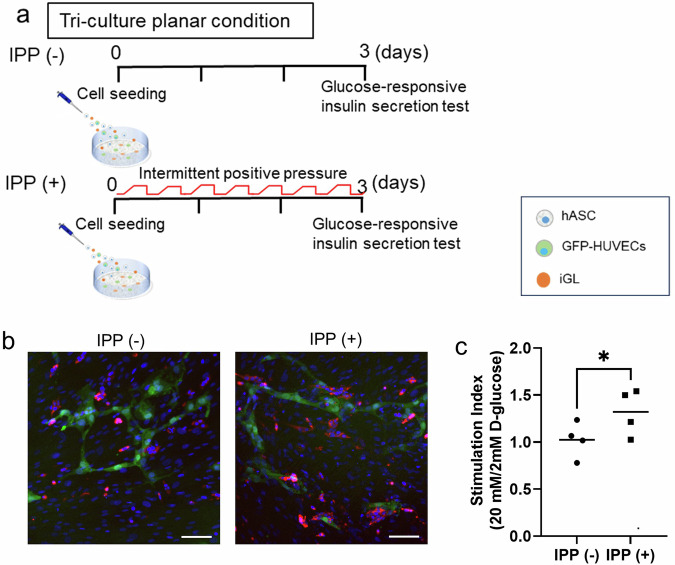
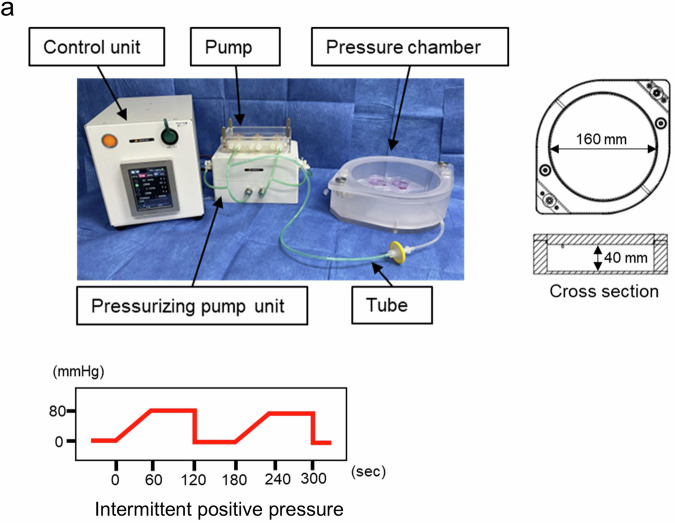
Constructing a dense vascular endothelial network within engineered tissue is crucial for successful engraftment. The present study investigated the effects of air-compressing intermittent positive pressure (IPP) on co-cultured mesenchymal stem cells and vascular endothelial cells and evaluated the potential of IPP-cultured cell sheets for transplantation therapy. The results demonstrated that the IPP (+) group exhibited a denser vascular endothelial network and significantly increased cell sheet thickness compared to the IPP (-) group. Furthermore, in vivo experiments showed that IPP-cultured cell sheets enhanced the secretion of Gaussian luciferase by genetically modified mesenchymal stem cells. These findings highlight the IPP method as a technique that simultaneously enables the thickening of planar tissues and the construction of vascular networks. This approach demonstrates promise for fabricating functional, transplantable, and thick tissues with dense vascularization and a high capacity for protein secretion, paving the way for novel applications in regenerative medicine.


Conflict of interest statement

Competing interests: Tokyo Women’s Medical University received research funding from CellSeed Inc. and Tokaihit Co., Ltd. Tatsuya Shimizu is a shareholder of CellSeed Inc. The other authors have no financial conflicts or competing interests to disclose.

Figures

Fig. 1
Fig. 1. Comparison in planar co-cultured condition between applied intermittent positive pressure and non-pressurization.
a Diagram of the co-cultured planar condition experiment. b Representative image of GFP-HUVECs (green) under intermittent positive pressure (IPP) (−) on day 1 (left) and day 3 (middle, right). Scale bar: 500 µm. c Representative image of GFP-HUVECs (green) under IPP (+) on day 1 (left) and day 3 (middle, right). Scale bar: 500 µm. d The total number of endothelial network junctions on day 3 (n = 8, measured from 8 independent culture dishes, with the mean of 3 randomly selected fields of view per dish, p = 0.10, Cohen’s d = 0.66). e The length of the endothelial network on day 3 (n = 8, measured from 8 independent culture dishes, with the mean of 3 randomly selected fields of view per dish, p = 0.09, Cohen’s d = 0.90). f The ratio of lactate production to glucose consumption (L/G ratio) on day 3 (n = 9, independent samples, **p < 0.01, Cohen’s d = 0.90). g The total number of the cells on day 3 (n = 9, independent samples, **p < 0.01, Cohen’s d = 0.69). h The percentage of GFP-HUVECs of the total cell number in the co-cultured cells in planar conditions (n = 9, independent samples, p = 0.50, Cohen’s d = 0.10). dh Plots in the graph show the value of each experiment and the bar shows the average. L/G: The ratio of lactate production to glucose consumption.
Fig. 2
Fig. 2. Comparison of vascular endothelial cells network in co-cultured cell sheet condition applied intermittent positive pressure and non-pressurization.
a Diagram of the experiment on the state of the co-cultured cell sheets. According to the schedule shown in the figure, cell seeding, cell sheet production, and evaluation of each item were carried out. b Representative images of GFP-HUVECs under IPP (−) on day 1 (left) and day 5 (middle, right). Scale bar: 500 µm. c Representative images of GFP-HUVECs (green) under IPP (+) on day 1 (left) and day 5 (middle, right). Scale bar: 500 µm. d Total number of endothelial network junctions on day 5 (n = 8, measured from 8 independent culture dishes, with the mean of 3 randomly selected fields of view per dish, **p < 0.01, Cohen’s d = 0.91). e Total length of the endothelial network on day 5 (n = 8, measured from 8 independent culture dishes, with the mean of 3 randomly selected fields of view per dish, **p < 0.01, Cohen’s d = 1.29). d, e Plots in the graph show the value of each experiment and the bar shows the average.
Fig. 3
Fig. 3. Comparison of morphological and compositional changes of co-cultured cell sheets applied intermittent positive pressure and non-pressurization.
a 3D-OCT images of the central section of a co-cultured cell sheet on day 5 days of IPP (−) (left) and IPP (+) (right). Scale bar: 50 µm. b The average thickness of cell sheets on day 5 measured using OCT images (n = 8, average thickness measured at 3 random locations on each cell sheet, **p < 0.01, Cohen’s d = 1.43). c Representative cross-sectional image of co-cultured cell sheets on day 5 cultured under IPP (−) (left) and IPP (+) (right) on day 5. Magnified views of the sections are shown alongside. The cell sheets were stained with hematoxylin and eosin (HE-stained). Scale bar: 100 µm. d Representative cross-sectional image of co-cultured cell sheets on day 5 cultured under IPP (−) (left) and IPP (+) (right). Magnified views of the sections are shown alongside. The cell sheet was stained with Sirius red. Scale bar: 100 µm. e The thickness of cell sheets on day 5 measured using HE-stained sections (n = 6, average thickness measured at 3 random locations on each cell sheet, *p < 0.05, Cohen’s d = 0.53). f The amount of collagen contained in the cell sheet (n = 4, independent samples, *p < 0.05, Cohen’s d = 0.91). g The total number of the cells in the cell sheet on day 5 (n = 8, independent samples, **p < 0.01, Cohen’s d = 0.95). h The percentage of GFP-HUVECs of the total cell number in the co-cultured cell sheet (n = 5, independent samples, p = 0.19, Cohen’s d = 1.47). i The percentage of cell viability in the co-cultured cell sheets on day 5 (n = 5, independent samples, **p < 0.01, Cohen’s d = 2.2). j The forward scatter of hASCs (left) (n = 3, independent samples, p = 0.91, Cohen’s d = 0.05) and GFP-HUVECs (right) (n = 3, independent samples, p = 0.43, Cohen’s d = 0.17) measured using a flow cytometry.
Fig. 4
Fig. 4. Comparison of air saturation at the bottom of the dish applied intermittent positive pressure and non-pressurization.
a Schematic diagram for the measurement of air saturation at the bottom of the dish in the area surrounding the cell sheet. b Representative data showing relative changes in air saturation. c Relative air saturation ratio of each experiment measured under IPP (−) / IPP (+) after 12 h, 24 h, and 48 h (n = 3).
Fig. 5
Fig. 5. Comparison of RNA expression in co-cultured cell sheets between intermittent positive pressure and non-pressurization.
a The relative expression of RNAs associated with endothelial mechanotransduction induced by shear stress (n = 3, independent samples). b The relative expression of RNAs associated with cell cycles (n = 3, independent samples). c The relative expression of RNAs associated with the extracellular matrix (ECM) and hemidesmosome (n = 3, independent samples). d The relative expression of RNAs associated with hypoxia-inducible factor (HIF) family (n = 3, independent samples). e The relative expression of RNAs associated with angiogenesis factors (n = 3, independent samples). ae The comparison was made between co-cultured cell sheets cultured under IPP (−)/IPP (+). The cell sheets were cultured for 5 days.
Fig. 6
Fig. 6. Effects of mild hypoxia on intermittent positive pressure-induced responses in co-cultured cell sheets and inhibition of shear stress pathways by L-NAME.
a The average thickness of cell sheets under mild hypoxia on day 5 measured using OCT images [IPP (−) vs IPP (+) (µm): n = 6, p = 0.94, Cohen’s d = 0.02]. b Total number of endothelial network junctions on day 5 [IPP (−) L-NAME (−) vs IPP (−) L-NAME (+) (count/mm2): n = 6, p = 0.56, Cohen’s d = 0.05], [IPP (−) L-NAME (+) vs IPP (+) L-NAME (+) (count/mm2): n = 6, p = 0.44, Cohen’s d = 0.50], [IPP ( + ) L-NAME (−) vs IPP (+) L-NAME (+) (count/mm2): n = 6, *p < 0.05, Cohen’s d = 1.14]. c The total length of the endothelial network on day 5 [IPP (−) L-NAME (−) vs IPP (−) L-NAME (+) (mm/mm2): n = 6, p = 0.84, Cohen’s d = 0.06], [IPP (−) L-NAME (+) vs IPP (+) L-NAME (+) (mm/mm2): n = 6, p = 0.31, Cohen’s d = 0.56], [IPP (+) L-NAME (−) vs IPP (+) L-NAME (+) (mm/mm2): n = 6, *p < 0.05, Cohen’s d = 1.31]. d Representative image of GFP-HUVECs (green) of each group on day 5. Scale bar: 500 μm. e The average thickness of cell sheets on day 5 measured using OCT images of each group [IPP (−) L-NAME (−) vs IPP −) L-NAME (+) (µm); 35.5 ± 4.9 vs 35.3 ± 4.9, n = 6, p = 0.91, Cohen’s d = 0.04], [IPP (−) L-NAME (+) vs IPP (+) L-NAME (+) (µm); 35.3 ± 4.9 vs 41.4 ± 6.3, n = 6, *p < 0.05, Cohen’s d = 1.09], [IPP (+) L-NAME (−) vs IPP (+) L-NAME (+) (µm); 40.4 ± 5.4 vs 41.4 ± 6.3, n = 6, p = 0.58, Cohen’s d = 0.17]. a, eN = 6, representing 6 cell sheets, with the average thickness measured at 3 random locations on each sheet. b, cN = 6, representing 6 cell sheets, with the evaluation of the endothelial vascular network performed in 3 randomly selected fields of view per sheet.
Fig. 7
Fig. 7. Functional comparison of intermittently positive pressurized and non-pressurized cell sheets transplanted subcutaneously in rats.
a Diagram of the experiment on the transplantation of co-cultured cell sheets. b, e Representative stereomicroscope images of a co-cultured cell sheet. The cell sheets were detached from the dish on day 5. Scale bar: 1 mm. c, f Representative images of a co-cultured cell sheet cultured under just after transplantation (left) and 2 days after transplantation (right). The white arrowheads indicate the region of the engrafted cell sheet. Scale bar: 1 mm. d, g Representative fluorescence image of a cell sheet (c or f) on day 2. The cell sheets are indicated in red as a consequence of m-Scarlet-I. Scale bar: 1 mm. h Representative images of fluorescence immunostained sections of the engrafted cell sheet 2 days after transplantation, IPP (−) (left) and IPP (+) (right). The cell sheets are labeled in red with the anti-RFP antibody. Scale bar: 100 µm. i Thickness of the engrafted cell sheets. (n = 5, average thickness measured at 3 random locations on each cell sheet, *p < 0.05, Cohen’s d = 1.06). j The intensity of Gaussia luciferase (GLuc) luminescence in blood serum on day 2 following cell sheet transplantation. (n = 6, independent samples, p = 0.13, Cohen’s d = 0.96). k Representative image of a transplanted co-cultured cell sheet captured by a stereomicroscope (left) and fluorescence microscope (middle). The merged image is shown on the right. The engrafted GFP-HUVECs formed tubular structures, which are indicated by the white arrows. It appears that the tube was filled with blood from the recipient rat. Scale bar: 100 µm. l Perfusion ratio of transplanted cell sheets on day 2 following transplantation. (n = 7, independent samples, p = 0.54, Cohen’s d = 0.60). GLuc: Gaussia luciferase.
Fig. 8
Fig. 8. Comparison of the ability of glucose-responsive insulin secretion of iGL cells tri-cultured in planar condition under intermittent positive pressure and non-pressurization.
a Diagram of tri-culture planar condition experiment including iGLs. b Representative image of tri-cultured cells under IPP (−; left) and IPP (+; right). The red color indicates iGLs, the green color indicates GFP-HUVECs and the blue color indicates the nucleus. Scale bar: 100 µm. c Glucose-stimulated insulin secretion index of iGLs cultured in planar condition under IPP (−) / IPP (+) on day 3. (n = 4, independent samples, *p < 0.05, Cohen’s d = 1.36).
Fig. 9
Fig. 9. A pressurization bioreactor system used in the experiment.
a A pressurization bioreactor system, consists of a control unit, a pressurizing pump unit, and a custom-made pressure chamber. Air is introduced into the chamber through the pump’s rotation via the tube. The volume of the chamber is calculated to be 803,840 mm³, based on its dimensions of 80 mm × 80 mm × 3.14 × 40 mm. A pressure of +80 mmHg was applied to the chamber every 180 s. IPP: Intermittent positive pressure.

References

    1. Baudequin, T. & Tabrizian, M. Multilineage constructs for scaffold-based tissue engineering: a review of tissue-specific challenges. Adv. Healthcare Mater.10.1002/adhm.201700734 (2018). - PubMed
    1. Kushida, A. et al. Decrease in culture temperature releases monolayer endothelial cell sheets together with deposited fibronectin matrix from temperature-responsive culture surfaces. J. Biomed. Mater. Res.45, 355–362 (1999). - PubMed
    1. Sekine, H. et al. In vitro fabrication of functional three-dimensional tissues with perfusable blood vessels. Nat. Commun.4,1399 (2013). - PMC - PubMed
    1. Yago, H. et al. The bioengineering of perfusable endocrine tissue with anastomosable blood vessels. Biofabrication15, 045010 (2023). - PubMed
    1. Hoeben, A. et al. Vascular endothelial growth factor and angiogenesis. Pharmacol. Rev.56, 549–580 (2004). - PubMed

LinkOut - more resources