Meta-Analysis
. 2025 Feb 8;15(1):4705.
doi: 10.1038/s41598-025-89472-5.

SARS-CoV-2 infection rates and associated risk factors in healthcare workers: systematic review and meta-analysis

Affiliations
Meta-Analysis

SARS-CoV-2 infection rates and associated risk factors in healthcare workers: systematic review and meta-analysis

Amit Bansal et al. Sci Rep. .

Abstract

To protect healthcare workforce during the COVID-19 pandemic, rigorous efforts were made to reduce infection rates among healthcare workers (HCWs), especially prior to vaccine availability. This study aimed to investigate the prevalence of SARS-CoV-2 infections among HCWs and identify potential risk factors associated with transmission. We searched MEDLINE, Embase, and Google Scholar from 1 December 2019 to 5 February 2024. From 498 initial records, 190 articles were reviewed, and 63 studies were eligible. ROBINS-E tool revealed a lower risk of bias in several domains; however, some concerns related to confounding and exposure measurement were identified. Globally, 11% (95% confidence interval (CI) 9-13) of 283,932 HCWs were infected with SARS-CoV-2. Infection rates were associated with a constellation of risk factors and major circulating SARS-CoV-2 variants. Household exposure (odds ratio (OR) 7.07; 95% CI 3.93-12.73), working as a cleaner (OR 2.72; 95% CI 1.39-5.32), occupational exposure (OR 1.79; 95% CI 1.49-2.14), inadequate training on infection prevention and control (OR 1.46; 95% CI 1.14-1.87), insufficient use of personal protective equipment (OR 1.45; 95% CI 1.14-1.84), performing aerosol generating procedures (OR 1.36; 95% CI 1.21-1.52) and inadequate hand hygiene (OR 1.17; 95% CI 0.79-1.73) were associated with an increased SARS-CoV-2 infection. Conversely, history of quarantine (OR 0.23; 95% CI 0.08-0.60) and frequent decontamination of high touch areas (OR 0.52; 95% CI 0.42-0.64) were protective factors against SARS-CoV-2 infection. This study quantifies the substantial global burden of SARS-CoV-2 infection among HCWs. We underscore the urgent need for effective infection prevention and control measures, particularly addressing factors such as household exposure and occupational practices by HCWs, including cleaning staff.

Keywords: COVID-19; Healthcare workers (HCWs); Household; Infection; Occupational; Quarantine; Risk factor; SARS-CoV-2.


Conflict of interest statement

Declarations. Competing interests: The authors declare no competing interests.

Figures
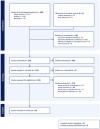
Fig. 1
Fig. 1
PRISMA Flow Diagram for selection of the studies in systematic review and meta-analysis. Figure was created using Covidence. Covidence is a web-based collaboration software platform that streamlines the production of systematic and other literature reviews. This study aimed to identify key risk and protective factors associated with SARS-CoV-2 infection among healthcare workers (HCWs). The included quantitative studies were published between 1 December 2019 and 5 February 2024 and investigated the association between risk factors and SARS-CoV-2 infection in HCWs. Three electronic databases, MEDLINE, Embase, and Google Scholar, were searched. Inclusion criteria restricted the search to studies involving human participants, published in English, and of specific article types (clinical trials, observational studies, letters, and case reports) (See Table 1 for details). Studies excluded due to “wrong setting” encompassed those with irrelevant characteristics or inappropriate design. The primary outcome measure was SARS-CoV-2 infection, confirmed by either a positive Reverse Transcription Polymerase Chain Reaction (RT-PCR) test, nucleoprotein seropositivity, or spike-protein seropositivity in unvaccinated individuals.
Fig. 2
Fig. 2
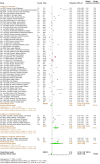
SARS-CoV-2 infection rates among healthcare workers. Meta-analysis of effect estimates was performed using the metaprop function (meta package) in R version 4.4.1. We used “Plogit” method or logit transformation for pooling of studies. SARS-CoV-2 infection rates with 95% confidence intervals (CIs) among HCWs were reported from 27 countries, including: Australia, Belgium, Canada, China, Colombia, Denmark, Democratic Republic of the Congo (DRC), Ethiopia, France, Germany, India, Iran, Ireland, Italy, Japan, Kenya, Mexico, Nigeria, Norway, Poland, Slovenia, Spain, Sweden, Switzerland, Turkey, the UK and the USA. Infection rates were plotted against major circulating variants of concerns as sub-group analysis. I2 is a statistic used in meta-analysis to estimate the proportion of total variance in effect sizes due to heterogeneity between studies. Diamonds representing meta-analysis results are printed in green colour and squares representing individual study results are printed in pink colour. A chi-square test (χ2) with degrees of freedom (df) and a p-value was conducted to assess differences between subgroups, indicating whether significant differences exist in the effects across subgroups (p < 0.05).
Fig. 3
Fig. 3
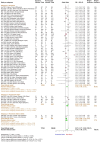
Forest plot to evaluate whether SARS-CoV-2 infection rates differed with occupational exposure to SARS-CoV-2 among healthcare workers. Data are presented as proportions and 95% confidence interval, CI. Meta-analysis of effect estimates was performed using the metabin function (meta package) in R version 4. 4.1. Pooling of studies was performed using Mantel–Haenszel method. Diamonds representing meta-analysis results are printed in green colour and squares representing individual study results are printed in pink colour. Forest plot was plotted against major circulating variants of concern as sub-group analysis. I2 is a statistic used in meta-analysis to estimate the proportion of total variance in effect sizes due to heterogeneity between studies. The z-score for the overall combined subgroup effect (common effect) evaluates the pooled effect size across all subgroups, while the z-score for the overall combined subgroup effect (random effects) considers both within-subgroup and between-subgroup variability. A chi-square test (χ2) with degrees of freedom (df) and a p-value was conducted to assess differences between subgroups, indicating whether significant differences exist in the effects across subgroups (p < 0.05).
Fig. 4
Fig. 4
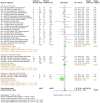
Forest plot to evaluate whether SARS-CoV-2 infection rates differed with personal protective equipment (PPE) use among healthcare workers. Data are presented as odds ratios, ORs, and 95% confidence interval, CI. Meta-analysis of effect estimates was performed using the metabin function (meta package) in R version 4. 4.1. Pooling of studies was performed using Mantel–Haenszel method. Diamonds representing meta-analysis results are printed in green colour and squares representing individual study results are printed in pink colour. I2 is a statistic used in meta-analysis to estimate the proportion of total variance in effect sizes due to heterogeneity between studies. The z-score for the overall combined subgroup effect (common effect) evaluates the pooled effect size across all subgroups, while the z-score for the overall combined subgroup effect (random effects) considers both within-subgroup and between-subgroup variability. A chi-square test (χ2) with degrees of freedom (df) and a p-value was conducted to assess differences between subgroups, indicating whether significant differences exist in the effects across subgroups (p < 0.05).
Fig. 5
Fig. 5
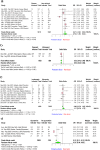
Forest plot to evaluate whether SARS-CoV-2 infection rates differed with infection prevention and control (IPC) training and performing aerosol-generating procedure among healthcare workers. (a) and (b) describes risk assessment following IPC training and performing aerosol-generating procedures respectively. Data are presented as odds ratios, ORs; and 95% confidence interval, CI. Meta-analysis of effect estimates was performed using the metabin function (meta package) in R version 4. 4.1. Pooling of studies was performed using Mantel–Haenszel method. Diamonds representing meta-analysis results are printed in green colour and squares representing individual study results are printed in pink colour. I2 is a statistic used in meta-analysis to estimate the proportion of total variance in effect sizes due to heterogeneity between studies.
Fig. 6
Fig. 6
Forest plot to evaluate whether SARS-CoV-2 infection rates differed with job profile as cleaner, frequent decontamination of high touch areas, hand hygiene, and quarantine among healthcare workers. (ad) describes risk assessment following job profile (as cleaner), frequent decontamination of high touch areas, hand hygiene, and history of quarantine. Data are presented as odds ratios, ORs; and 95% confidence interval, CI. Meta-analysis of effect estimates was performed using the metabin function (meta package) in R version 4. 4.1. Pooling of studies was performed using Mantel–Haenszel method. Diamonds representing meta-analysis results are printed in green colour and squares representing individual study results are printed in pink colour. I2 is a statistic used in meta-analysis to estimate the proportion of total variance in effect sizes due to heterogeneity between studies.
Fig. 7
Fig. 7
Forest plot to evaluate whether SARS-CoV-2 infection rates differed with household exposure to SARS-CoV-2 among healthcare workers. Data are presented as odds ratios, ORs; and 95% confidence interval, CI. Meta-analysis of effect estimates was performed using the metabin function (meta package) in R version 4. 4.1. Pooling of studies was performed using Mantel–Haenszel method. Diamonds representing meta-analysis results are printed in green colour and squares representing individual study results are printed in pink colour. I2 is a statistic used in meta-analysis to estimate the proportion of total variance in effect sizes due to heterogeneity between studies.

References

    1. Petersen, E. et al. Comparing SARS-CoV-2 with SARS-CoV and influenza pandemics. Lancet. Infect. Dis.20, e238–e244. 10.1016/S1473-3099(20)30484-9 (2020). - PMC - PubMed
    1. Mishra, C. et al. Increasing risks for emerging infectious diseases within a rapidly changing High Asia. Ambio51, 494–507. 10.1007/s13280-021-01599-7 (2022). - PMC - PubMed
    1. Smith, K. F. et al. Global rise in human infectious disease outbreaks. J. R. Soc. Interface11, 20140950. 10.1098/rsif.2014.0950 (2014). - PMC - PubMed
    1. World Health Organization. Timeline of WHO’s response to COVID-19, https://www.who.int/news-room/detail/29-06-2020-covidtimeline (2020).
    1. World Health Organization. WHO Coronavirus Disease (COVID-19) Dashboard, https://covid19.who.int (2024).