

Preoperative prediction of IDH genotypes and prognosis in adult-type diffuse gliomas: intratumor heterogeneity habitat analysis using dynamic contrast-enhanced MRI and diffusion-weighted imaging
- PMID: 39923105
- PMCID: PMC11807326
- DOI: 10.1186/s40644-025-00829-5
Preoperative prediction of IDH genotypes and prognosis in adult-type diffuse gliomas: intratumor heterogeneity habitat analysis using dynamic contrast-enhanced MRI and diffusion-weighted imaging
Abstract
Background: Intratumor heterogeneity (ITH) is a key biological characteristic of gliomas. This study aimed to characterize ITH in adult-type diffuse gliomas and assess the feasibility of using habitat imaging based on dynamic contrast-enhanced magnetic resonance imaging (DCE-MRI) and diffusion-weighted imaging (DWI) to preoperatively predict isocitrate dehydrogenase (IDH) genotypes and prognosis.
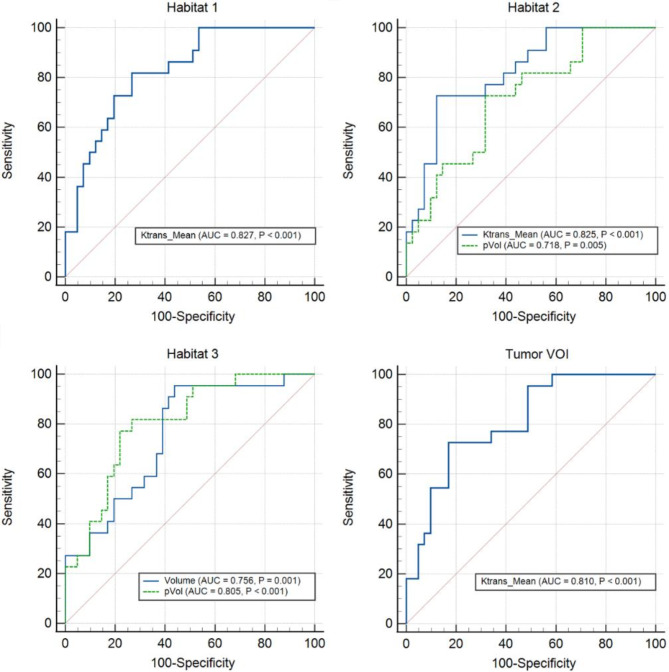
Methods: Sixty-three adult-type diffuse gliomas with known IDH genotypes were enrolled. Volume transfer constant (Ktrans) and apparent diffusion coefficient (ADC) maps were acquired from DCE-MRI and DWI, respectively. After tumor segmentation, the k-means algorithm clustered Ktrans and ADC image voxels to generate spatial habitats and extract quantitative image features. Receiver operating characteristic (ROC) curves and area under the curve (AUC) were used to evaluate IDH predictive performance. Multivariable logistic regression models were constructed and validated using leave-one-out cross-validation, and the contrast-enhanced subgroup was analyzed independently. Kaplan-Meier and Cox proportional hazards regression analyses were used to investigate the relationship between tumor habitats and progression-free survival (PFS) in the two IDH groups.
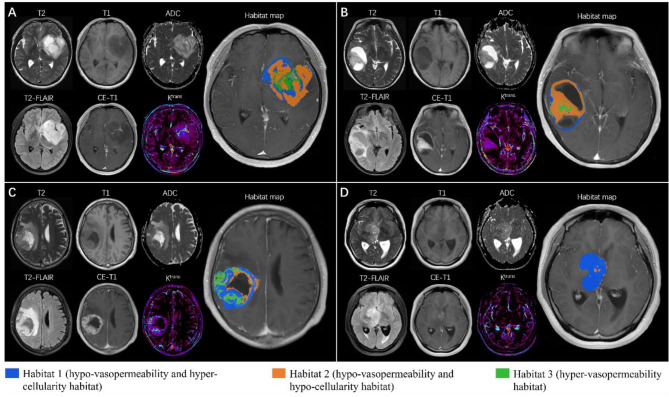
Results: Three habitats were identified: Habitat 1 (hypo-vasopermeability and hyper-cellularity), Habitat 2 (hypo-vasopermeability and hypo-cellularity), and Habitat 3 (hyper-vasopermeability). Compared to the IDH wild-type group, the IDH mutant group exhibited lower mean Ktrans values in Habitats 1 and 2 (both P < 0.001), higher volume (P < 0.05) and volume percentage (pVol, P < 0.01) of Habitat 2, and lower volume and pVol of Habitat 3 (both P < 0.001). The optimal logistic regression model for IDH prediction yielded an AUC of 0.940 (95% confidence interval [CI]: 0.880-1.000), which improved to 0.948 (95% CI: 0.890-1.000) after cross-validation. Habitat 2 contributed the most to the model, consistent with the findings in the contrast-enhanced subgroup. In IDH wild-type group, pVol of Habitat 2 was identified as a significant risk factor for PFS (high- vs. low-pVol subgroup, hazard ratio = 2.204, 95% CI: 1.061-4.580, P = 0.034), with a value below 0.26 indicating a 5-month median survival benefit.
Conclusions: Habitat imaging employing DCE-MRI and DWI may facilitate the characterization of ITH in adult-type diffuse gliomas and serve as a valuable adjunct in the preoperative prediction of IDH genotypes and prognosis.
Clinical trial number: Not applicable.
Keywords: Adult-type diffuse glioma; Diffusion-weighted imaging; Dynamic contrast-enhanced perfusion; Intratumor heterogeneity; Isocitrate dehydrogenase; Progression-free survival.
© 2025. The Author(s).
Conflict of interest statement
Declarations. Ethics approval and consent to participate: This retrospective clinical study obtained approval from the Ethics Committee of Renji Hospital, Shanghai Jiao Tong University School of Medicine (approval number: LY2023-154-B). The requirement for informed consent from patients was waived due to the retrospective nature of the study. All methods were performed in accordance with relevant guidelines and regulations. Consent for publication: Not applicable. Competing interests: The authors declare no competing interests.
Figures


Similar articles
-
MRI-based habitat radiomics for preoperatively predicting IDH status in gliomas.Neurosurg Focus. 2025 Aug 1;59(2):E4. doi: 10.3171/2025.5.FOCUS25135. Neurosurg Focus. 2025. PMID: 40749226
-
Advanced imaging parameters improve the prediction of diffuse lower-grade gliomas subtype, IDH mutant with no 1p19q codeletion: added value to the T2/FLAIR mismatch sign.Eur Radiol. 2020 Feb;30(2):844-854. doi: 10.1007/s00330-019-06395-2. Epub 2019 Aug 24. Eur Radiol. 2020. PMID: 31446467
-
Ultra-high b-value DWI accurately identifies isocitrate dehydrogenase genotypes and tumor subtypes of adult-type diffuse gliomas.Eur Radiol. 2024 Oct;34(10):6751-6762. doi: 10.1007/s00330-024-10708-5. Epub 2024 Mar 25. Eur Radiol. 2024. PMID: 38528135
-
Imaging prediction of isocitrate dehydrogenase (IDH) mutation in patients with glioma: a systemic review and meta-analysis.Eur Radiol. 2019 Feb;29(2):745-758. doi: 10.1007/s00330-018-5608-7. Epub 2018 Jul 12. Eur Radiol. 2019. PMID: 30003316
-
Advanced MR Techniques for Preoperative Glioma Characterization: Part 2.J Magn Reson Imaging. 2023 Jun;57(6):1676-1695. doi: 10.1002/jmri.28663. Epub 2023 Mar 13. J Magn Reson Imaging. 2023. PMID: 36912262 Free PMC article. Review.
Cited by
-
Preoperative Adult-Type Diffuse Glioma Subtype Prediction with Dynamic Contrast-Enhanced MR Imaging and Diffusion Weighted Imaging in Tumor Cores and Peritumoral Tissue-A Standardized Multicenter Study.Diagnostics (Basel). 2025 Feb 21;15(5):532. doi: 10.3390/diagnostics15050532. Diagnostics (Basel). 2025. PMID: 40075780 Free PMC article.
References
MeSH terms
Substances
Grants and funding
- No. 24ZR1408500/Natural Science Foundation of Shanghai
- No. 82171885/National Natural Science Foundation of China
- No. 21TS1400700/Shanghai Science and Technology Committee Project
- No. 2022LJ023/Leading Talent of Shanghai Municipal Health Commission
- No. SHDC22023022/Technology standardized management and promotion projects of Shanghai ShenKang Hospital Development
LinkOut - more resources
Full Text Sources
Medical
