. 2025 Feb 8;16(1):59.
doi: 10.1186/s13287-025-04141-8.

Mesenchymal stem cells from perinatal tissues promote diabetic wound healing via PI3K/AKT activation

Affiliations

Mesenchymal stem cells from perinatal tissues promote diabetic wound healing via PI3K/AKT activation

Jiawei Huang et al. Stem Cell Res Ther. .

Abstract

Background: Diabetic foot ulcers (DFUs) represent a major complication of diabetes, often leading to poor healing outcomes with conventional treatments. Mesenchymal stem cell (MSC) therapies have emerged as a promising alternative, given their potential to modulate various pathways involved in wound healing. This study evaluates and compares the therapeutic potential of MSCs derived from perinatal tissues-human umbilical cord MSCs (hUCMSCs), human chorionic villi MSCs (hCVMSCs), and human decidua basalis MSCs (hDCMSCs)-in a diabetic wound healing model.

Methods: We performed in vitro and in vivo studies to compare the efficacy of hUCMSCs, hCVMSCs, and hDCMSCs. Mass spectrometry was used to analyze the secreted proteins of the MSCs. We incorporated the MSCs into a polyethylene glycol diacrylate (PEGDA) and sodium alginate (SA) hydrogel matrix with collagen I (Col-I) to evaluate their effects on wound healing.

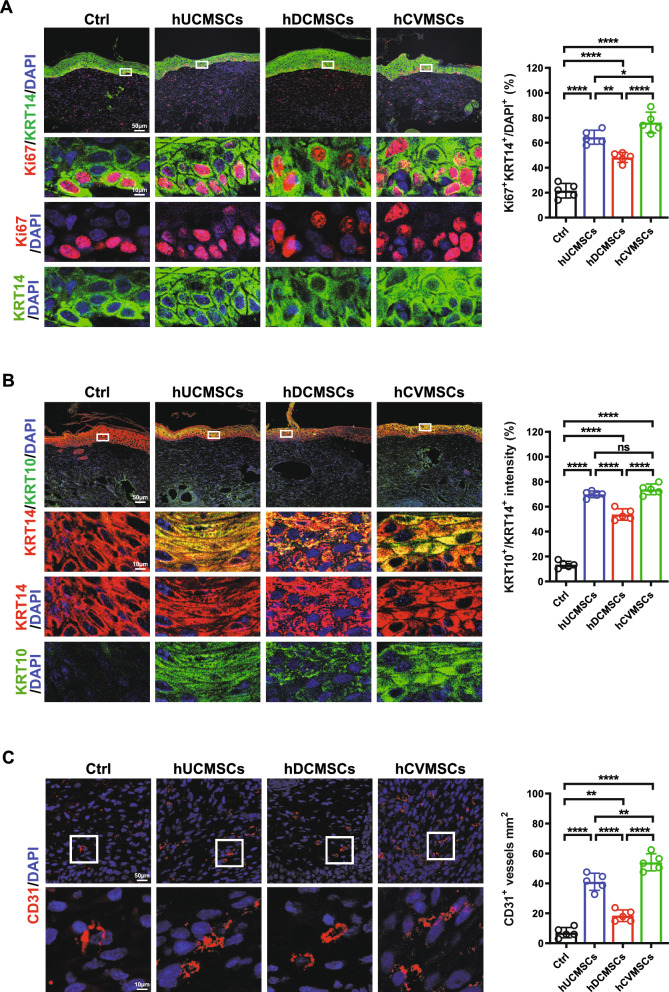
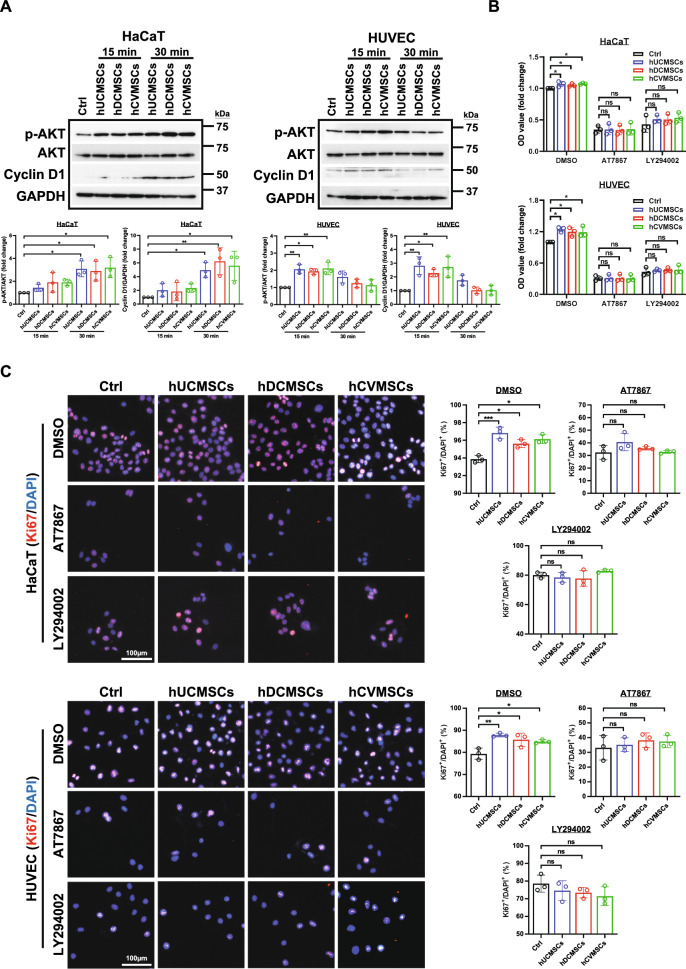
Results: All three types of MSCs promoted wound healing, with hUCMSCs and hCVMSCs showing stronger effects compared to hDCMSCs. Both hUCMSCs and hCVMSCs demonstrated robust wound healing kinetics, with enhanced keratinocyte proliferation (KRT14+/Ki67+ cells), maturation (KRT10/KRT14 ratio), and angiogenesis. In vitro studies demonstrated that the MSC-derived secretome enhanced keratinocyte proliferation and migration, endothelial cell function and stem cell recruitment, indicating robust paracrine effects. Mass spectrometry revealed a conserved set of proteins including THBS1 (thrombospondin 1), SERPINE1 (serpin family E member 1), ANXA1 (annexin A1), LOX (lysyl oxidase), and ITGB1 (integrin beta-1) which are involved in extracellular matrix (ECM) organization and wound healing, with the PI3K/AKT signaling pathway playing a central role. The PEGDA/SA/Col-I hydrogel demonstrated a unique balance of mechanical and biological properties and an optimal environment for MSC viability and function. Application of either hUCMSC- or hCVMSC-laden hydrogels resulted in accelerated wound closure, improved re-epithelialization, increased collagen deposition, and enhanced vascularization in vivo.

Conclusions: MSCs From perinatal tissues particularly hUCMSCs and hCVMSCs significantly enhance diabetic wound healing through PI3K/AKT pathway activation while hDCMSCs exhibited weaker efficacy. The PEGDA/SA/Col-I hydrogel supports MSC viability and function offering a promising scaffold for DFU treatment. These findings underscore the potential of specific perinatal MSCs and optimized hydrogel formulations in advancing diabetic wound care.

Keywords: Diabetic wound healing; Hydrogel; MSCs; PI3K/AKT; Placenta.


Conflict of interest statement

Declarations. Ethics approval and consent to participate: Isolation of human umbilical cord- and placenta-derived MSCs was approved by the Joint CUHK-NTEC Clinical Research Ethics Committee (Title: Placenta derived genes analysis in placenta and maternal circulation in singleton pregnancies complicated with fetal growth restriction; Ref: 2020.313; Year of approval: 2020). The use of human bone marrow for MSC isolation was approved by Joint CUHK-NTEC Clinical Research Ethics Committee (Title: A novel preclinical treatment strategy for enhancing chemosensitivity of pediatric B-precursor acute lymphoblastic leukemia by disruption of leukemia-stroma interaction using CD9-neutralizing antibody in a mouse model; Ref: 2015.018; Year of approval: 2015). Written informed consent for participation in the study or the use of samples was provided to the patients or their guardians. All animal use and research protocols in this study were approved by the Laboratory Animal Experimentation Ethical Committee, Chinese University of Hong Kong (Title: Development of stem cell-based therapy for diabetic foot ulcer (DFU); Ref: 21–162-MIS; Year of approval: 2021) and were in accordance with the Guideline for the Care and Use of Laboratory Animals. Consent for publication: Not applicable. Competing interests: The authors declare that they have no competing interests.

Figures

Fig. 1
Fig. 1
Human perinatal MSCs promote diabetic wound healing. A Illustration of diabetic wound healing with different hMSCs (hUCMSCs, hDCMSCs, hCVMSCs) treatment derived from perinatal tissues; B Representative photographs of full-thickness excision wounds at 0, 3, 5, 7 and 10 days after wounding. Dynamic traces of wound sites are shown on the right; C The relative wound size is shown for each group (hUCMSCs, hDCMSCs, hCVMSCs), with n = 5 for all groups. Wound areas are normalized to the original wound size and expressed as the percentage of wound closure versus initial wound size. All data are presented as mean ± SD. *, **, ***and **** represent p < 0.05,0.01, 0.001and 0.0001, respectively, compared to the control group. The symbol & represents p < 0.05 for comparisons between hCVMSCs and hDCMSCs, and the symbol # indicates p < 0.05 for comparisons between hUCMSCs and hDCMSCs. Statistical significance is determined using Tukey's post-hoc test following a one-way ANOVA (p < 0.05); D Mean area-under-curve (AUC) of individual wounds of each group, n = 5 for all groups. The AUC of individual wounds in the treatment groups was normalized against the mean AUC of vehicle controls within the same experimental runs. All data are presented as mean ± SD. *,**, and **** represent p < 0.05,0.01, and 0.0001, respectively, by Tukey’s post-hoc test when statistical significance by One-way ANOVA (p < 0.05) is obtained; E Representative hematoxylin and eosin (H&E) of wounds on day 7 and day 10 for each group, scale bar = 500 μm and 100 μm. Quantification of granulation tissue gap and epidermal thickness on day 10 is shown on the right, n = 5 for all groups. All data are presented as mean ± SD. **represents p < 0.01 by Tukey’s post-hoc test when statistical significance by One-way ANOVA (p < 0.05) is obtained; F Masson’s trichrome staining (MTS) of wounds on day 7 and day 10 for each group, scale bar = 500 μm and 100 μm. Quantification of collagen deposition of the wounds on day 10, n = 5 for all groups. All data are presented as mean ± SD. *** and **** represent p < 0.01, and 0.001, respectively, by Tukey’s post-hoc test when statistical significance by One-way ANOVA(p < 0.05) is obtained
Fig. 2
Fig. 2
Human perinatal MSCs promote re-epithelization and angiogenesis. A Representative immunofluorescence (IF) images of Ki67 and KRT14 staining in wounds on day 10 for each group. Quantification of Ki67 + and KRT14 + double positive cells is shown on the right; B Representative IF images of KRT10 and KRT14 staining in wounds on day 10 for each experimental group. Quantification of the average intensity percentage of KRT10 + versus KRT14 + is shown on the right; C Representative IF images of CD31 staining in wounds on day 10 for each experimental group. Quantification of CD31 + cells per unit area is shown on the right. All data are presented as mean ± SD, n = 5 for all groups. Scale bar = 50 μm and 10 μm. *, ** and **** represent p < 0.05, 0.01 and 0.0001, respectively, by Tukey’s post-hoc test when statistical significance by One-way ANOVA (p < 0.05) is obtained.
Fig. 3
Fig. 3
The secretome derived from human perinatal MSCs promotes proliferation, migration and angiogenesis in HaCaT and HUVECs in vitro. A MTT assay results showing the viability of HaCaT and HUVECs treated with secretome derived from different hMSCs, data are derived from three independent experiments; B Images from the wound scratch healing assay for HaCaT and HUVECs treated with secretome derived from different hMSCs, scale bar = 100 μm. Quantification of HaCaT and HUVECs migration is shown on the right. Data are derived from three independent experiments, each with triplicates; C Tube formation assay of HUVECs on matrigel after incubation with different secretome for 6 h, scale bar = 100 μm. Quantification of the number of nodes and junction is shown on the right. Data are derived from five independent experiments. All data are presented as mean ± SD. *, **, *** and **** represent p < 0.05, 0.01, 0.001 and 0.0001, respectively, by Tukey’s post-hoc test when statistical significance by One-way ANOVA(p < 0.05) is obtained
Fig. 4
Fig. 4
Comparative analysis of secretome profiles of perinatal MSCs. A Heat map showing the global protein expression profile of hUCMSCs (n = 2), hDCMSCs (n = 2) and hCVMSCs (n = 2) as determined by mass spectrometry; B Venn diagram illustrating the numbers of common and distinctive proteins identified by proteomics in each placental MSC group; C GO enrichment analysis of the 435 commonly expressed proteins; D Heat map analysis showing the differential expression of proteins associated with extracellular matrix organization and wound healing in the secretome of placental MSCs (compared with hUCMSCs); E Sankey dot plot of biological processes for the 52 commonly expressed proteins associated with wound healing; F KEGG pathway analysis of the 435 commonly expressed proteins; G Heat map analysis showing the differential expression of proteins associated with the PI3K/AKT pathway in the secretome of placental MSCs (compared with hUCMSCs)
Fig. 5
Fig. 5
The secretome derived from perinatal MSCs promotes cell proliferation via the PI3K/AKT pathway. A HaCaT and HUVEC cells were treated with secretome derived from hUCMSCs, hCVMSCs, or hDCMSCs for the indicated time points. Representative western blot images and quantification showed changes in the expression levels of p-AKT and Cyclin D1. B Cell viability of HaCaT and HUVEC cells treated with secretome derived from hUCMSCs, hCVMSCs, or hDCMSCs in the presence or absence of the AKT inhibitor AT7867 (5 μM) or the PI3K inhibitor LY294002 (50 μM); C Representative immunofluorescent staining images and quantification of Ki67-positive HaCaT and HUVEC cells following 4 days of inhibitor treatment (scale bar = 100 μm). Experiments were repeated at least three times, and quantification data represented mean ± SD, *, **, and *** represent p<0.05, 0.01, and 0.001 by Tukey’s post-hoc test when statistical significance by One-way ANOVA(p < 0.05) is obtained
Fig. 6
Fig. 6
The secretome derived from perinatal MSCs promotes cell migration via the PI3K/AKT pathway. A Wound healing assay images and quantification of HaCaT and HUVEC cells cultured in media supplemented with secretome derived from hUCMSCs, hCVMSCs, or hDCMSCs in the presence or absence of the inhibitors; B Representative immunofluorescent staining images and quantification of the mean Vimentin intensity in HaCaT and HUVEC cells following one day of inhibitor treatment (scale bar = 100 μm). Experiments were repeated at least three times, and quantification data represented mean ± SD, * and ** represent p0.05 and 0.01 by Tukey’s post-hoc test when statistical significance by One-way ANOVA(p < 0.05) is obtained
Fig. 7
Fig. 7
PEGDA/SA/Col-I hydrogel encapsulation enhances MSCs survival and secretion in vitro. A Measurement of the compressive modulus of the hydrogels. The hydrogels were all compressed by 50% of height to measure the compressive modulus. Images on the left show that after compression, the PEGDA/SA/Col-I hydrogel retained its shape the best among all hydrogels tested, suggesting its potential as an elastic wound dressing; B Live/Dead fluorescent images of hUCMSCs and hCVMSCs cultured within PEGDA/SA/Col-I hydrogel for 1 and 3 days (scale bar = 600 μm); C MTS assay results determining the cell viability of hUCMSCs and hCVMSCs encapsulated in the PEGDA/SA/Col-I hydrogel; D Quantification of the total secreted protein content from MSCs-laden PEGDA/SA/Col-I hydrogel; E hUCMSCs and hCVMSCs cultured in 2D or encapsulated in 3D PEGDA/SA/Col-I hydrogel were treated with H2O2 (300 mM) for 2 h, and cell viability was assessed by MTS assay; F hUCMSCs and hCVMSCs cultured in 2D or encapsulated in 3D PEGDA/SA/Col-I hydrogel were treated with high-glucose (200 mM) for 24 h, and cell viability was assessed by MTS assay. Experiments were repeated at least three times, and quantification data represented mean ± SD. *, **, *** and **** represent p < 0.05,0.01, 0.001, and 0.0001 by Student Ttest or One-way ANOVA(p < 0.05)
Fig. 8
Fig. 8
PEGDA/SA/Col-I hydrogel encapsulation enhances MSC therapeutic efficacy for diabetic wound healing. A Representative photographs of full-thickness excision wounds at 0, 3, 5, 7, 9 and 11 days after wounding. Dynamic traces of wound sites are shown on the right; B The relative wound size is shown for each group, with n = 5 for all groups. Wound areas are normalized to the original wound size and expressed as the percentage of wound closure versus initial wound size. All data are presented as mean ± SD. *, **, ***and **** represent p < 0.05,0.01, 0.001and 0.0001, respectively, compared to the control group. The symbols # and ### represent p < 0.05 and 0.001, respectively, for comparisons between MSC group and hydrogel group. The symbols ^, ^^, ^^^and ^^^^ represent p < 0.05,0.01, 0.001and 0.0001 for comparisons between MSC-laden hydrogel and hydrogel only group. The symbols && and &&&& represent p < 0.01 and 0,0001 for comparisons between MSC-laden hydrogel and MSC group. Statistical significance is determined using Tukey's post-hoc test following a one-way ANOVA (p < 0.05); C Mean area-under-curve (AUC) of individual wounds of each group, n = 5 for all groups. The AUC of individual wounds in the treatment groups was normalized against the mean AUC of vehicle controls within the same experimental runs. All data are presented as mean ± SD. **, and **** represent p < 0.01, and 0.0001, respectively, by Tukey’s post-hoc test when statistical significance by One-way ANOVA (p < 0.05) is obtained; D Representative hematoxylin and eosin (H&E) of wounds on day 7 and day 11 for each group, scale bar = 500 μm and 100 μm. Quantification of granulation tissue gap and epidermal thickness on day 11 is shown on the right, n = 5 for all groups. All data are presented as mean ± SD. *, **, ***and **** represent p < 0.05,0.01, 0.001and 0.0001, respectively, by Tukey’s post-hoc test when statistical significance by One-way ANOVA (p < 0.05) is obtained; E Masson’s trichrome staining (MTS) of wounds on day 7 and day 11 for each group, scale bar = 500 μm and 100 μm. Quantification of collagen deposition of the wounds on day 10, n = 5 for all groups. All data are presented as mean ± SD. * and **** represent p < 0.05, and 0.0001, respectively, by Tukey’s post-hoc test when statistical significance by One-way ANOVA(p < 0.05) is obtained
Fig. 9
Fig. 9
PEGDA/SA/Col-I hydrogel encapsulation enhances MSC therapeutic efficacy for diabetic wound healing. A Representative immunofluorescence (IF) images of Ki67 and KRT14 staining in wounds on day 11 for each experimental group. Quantification of Ki67 + and KRT14 + double positive cells is shown on the right; B Representative IF images of KRT10 and KRT14 staining in wounds on day 11 for each experimental group. Quantification of the average intensity percentage of KRT10 + versus KRT14 + is shown on the right; C Representative IF images of CD31 staining in wounds on day 11 for each experimental group. Quantification of CD31 + cells per unit area is shown on the right. All data are presented as mean ± SD, n = 5 for all groups. Scale bar = 50 μm and 10 μm. *, **, *** and **** represent p < 0.05, 0.01,0.001 and 0.0001, respectively, by Tukey’s posthoc test when statistical significance by One-way ANOVA(p < 0.05) is obtained

Similar articles

Cited by

References

    1. Armstrong DG, Boulton AJM, Bus SA. Diabetic foot ulcers and their recurrence. N Engl J Med. 2017;376(24):2367–75. - PubMed
    1. Meloni M, Izzo V, Giurato L, Lazaro-Martinez JL, Uccioli L. Prevalence, clinical aspects and outcomes in a large cohort of persons with diabetic foot disease: comparison between neuropathic and ischemic ulcers. J Clin Med. 2020;9(6):1780. - PMC - PubMed
    1. Pendsey SP. Understanding diabetic foot. Int J Diabetes Dev Ctries. 2010;30(2):75–9. - PMC - PubMed
    1. Baltzis D, Eleftheriadou I, Veves A. Pathogenesis and treatment of impaired wound healing in diabetes mellitus: new insights. Adv Ther. 2014;31(8):817–36. - PubMed
    1. Yu X, Liu P, Li Z, Zhang Z. Function and mechanism of mesenchymal stem cells in the healing of diabetic foot wounds. Front Endocrinol (Lausanne). 2023;14:1099310. - PMC - PubMed

Substances