Diagnosis of Chronic Kidney Disease Using Retinal Imaging and Urine Dipstick Data: Multimodal Deep Learning Approach
- PMID: 39924305
- PMCID: PMC11830489
- DOI: 10.2196/55825
Diagnosis of Chronic Kidney Disease Using Retinal Imaging and Urine Dipstick Data: Multimodal Deep Learning Approach
Abstract
Background: Chronic kidney disease (CKD) is a prevalent condition with significant global health implications. Early detection and management are critical to prevent disease progression and complications. Deep learning (DL) models using retinal images have emerged as potential noninvasive screening tools for CKD, though their performance may be limited, especially in identifying individuals with proteinuria and in specific subgroups.
Objective: We aim to evaluate the efficacy of integrating retinal images and urine dipstick data into DL models for enhanced CKD diagnosis.
Methods: The 3 models were developed and validated: eGFR-RIDL (estimated glomerular filtration rate-retinal image deep learning), eGFR-UDLR (logistic regression using urine dipstick data), and eGFR-MMDL (multimodal deep learning combining retinal images and urine dipstick data). All models were trained to predict an eGFR<60 mL/min/1.73 m², a key indicator of CKD, calculated using the 2009 CKD-EPI (Chronic Kidney Disease Epidemiology Collaboration) equation. This study used a multicenter dataset of participants aged 20-79 years, including a development set (65,082 people) and an external validation set (58,284 people). Wide Residual Networks were used for DL, and saliency maps were used to visualize model attention. Sensitivity analyses assessed the impact of numerical variables.
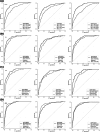
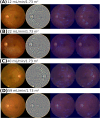
Results: eGFR-MMDL outperformed eGFR-RIDL in both the test and external validation sets, with area under the curves of 0.94 versus 0.90 and 0.88 versus 0.77 (P<.001 for both, DeLong test). eGFR-UDLR outperformed eGFR-RIDL and was comparable to eGFR-MMDL, particularly in the external validation. However, in the subgroup analysis, eGFR-MMDL showed improvement across all subgroups, while eGFR-UDLR demonstrated no such gains. This suggested that the enhanced performance of eGFR-MMDL was not due to urine data alone, but rather from the synergistic integration of both retinal images and urine data. The eGFR-MMDL model demonstrated the best performance in individuals younger than 65 years or those with proteinuria. Age and proteinuria were identified as critical factors influencing model performance. Saliency maps indicated that urine data and retinal images provide complementary information, with urine offering insights into retinal abnormalities and retinal images, particularly the arcade vessels, being key for predicting kidney function.
Conclusions: The MMDL model integrating retinal images and urine dipstick data show significant promise for noninvasive CKD screening, outperforming the retinal image-only model. However, routine blood tests are still recommended for individuals aged 65 years and older due to the model's limited performance in this age group.
Keywords: chronic kidney disease; fundus image; multimodal deep learning; saliency map; urine dipstick.
© Youngmin Bhak, Yu Ho Lee, Joonhyung Kim, Kiwon Lee, Daehwan Lee, Eun Chan Jang, Eunjeong Jang, Christopher Seungkyu Lee, Eun Seok Kang, Sehee Park, Hyun Wook Han, Sang Min Nam. Originally published in JMIR Medical Informatics (https://medinform.jmir.org).
Conflict of interest statement
Figures


References
-
- Wen J, Liu D, Wu Q, Zhao L, Iao WC, Lin H. Retinal image‐based artificial intelligence in detecting and predicting kidney diseases: current advances and future perspectives. [18-01-2025];VIEW. 2023 Jun;4(3):20220070. doi: 10.1002/VIW.20220070. https://onlinelibrary.wiley.com/toc/2688268x/4/3 URL. Accessed. doi. - DOI
-
- van der Velde M, Matsushita K, Coresh J, et al. Lower estimated glomerular filtration rate and higher albuminuria are associated with all-cause and cardiovascular mortality. A collaborative meta-analysis of high-risk population cohorts. Kidney Int. 2011 Jun;79(12):1341–1352. doi: 10.1038/ki.2010.536. doi. - DOI - PubMed
MeSH terms
LinkOut - more resources
Full Text Sources
Medical
Research Materials
Miscellaneous

