Review
. 2025;221(1):13.
doi: 10.1007/s11214-025-01137-x. Epub 2025 Feb 5.

Mass Supply from Io to Jupiter's Magnetosphere

Affiliations
Review

Mass Supply from Io to Jupiter's Magnetosphere

Lorenz Roth et al. Space Sci Rev. 2025.

Abstract

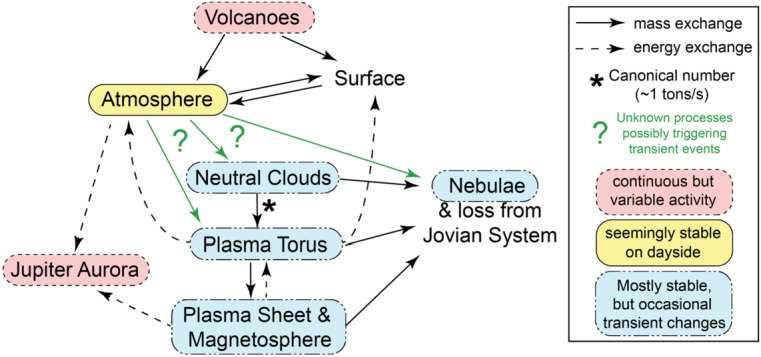
Since the Voyager mission flybys in 1979, we have known the moon Io to be both volcanically active and the main source of plasma in the vast magnetosphere of Jupiter. Material lost from Io forms neutral clouds, the Io plasma torus and ultimately the extended plasma sheet. This material is supplied from Io's upper atmosphere and atmospheric loss is likely driven by plasma-interaction effects with possible contributions from thermal escape and photochemistry-driven escape. Direct volcanic escape is negligible. The supply of material to maintain the plasma torus has been estimated from various methods at roughly one ton per second. Most of the time the magnetospheric plasma environment of Io is stable on timescales from days to months. Similarly, Io's atmosphere was found to have a stable average density on the dayside, although it exhibits lateral (longitudinal and latitudinal) and temporal (both diurnal and seasonal) variations. There is a potential positive feedback in the Io torus supply: collisions of torus plasma with atmospheric neutrals are probably a significant loss process, which increases with torus density. The stability of the torus environment may be maintained by limiting mechanisms of either torus supply from Io or the loss from the torus by centrifugal interchange in the middle magnetosphere. Various observations suggest that occasionally (roughly 1 to 2 detections per decade) the plasma torus undergoes major transient changes over a period of several weeks, apparently overcoming possible stabilizing mechanisms. Such events (as well as more frequent minor changes) are commonly explained by some kind of change in volcanic activity that triggers a chain of reactions which modify the plasma torus state via a net change in supply of new mass. However, it remains unknown what kind of volcanic event (if any) can trigger events in torus and magnetosphere, whether Io's atmosphere undergoes a general change before or during such events, and what processes could enable such a change in the otherwise stable torus. Alternative explanations, which are not invoking volcanic activity, have not been put forward. We review the current knowledge on Io's volcanic activity, atmosphere, and the magnetospheric neutral and plasma environment and their roles in mass transfer from Io to the plasma torus and magnetosphere. We provide an overview of the recorded events of transient changes in the torus, address several contradictions and inconsistencies, and point out gaps in our current understanding. Lastly, we provide a list of relevant terms and their definitions.


Conflict of interest statement

Competing InterestsThe authors have no relevant financial or non-financial interests to disclose.

Figures

Fig. 1
Fig. 1
Different scenarios for a stable plasma torus based on the curves of supply to the torus (solid) and of loss from the torus (dashed) as a function of torus ion density (Schneider et al. 1989). Equilibrium points are reached where the lines cross (black dot). All shown scenarios lead to a stable torus at some plasma (ion) density
Fig. 2
Fig. 2
(Left) Transient enhancement of the sodium neutral cloud and sulfur torus ion emissions from Brown and Bouchez (1997), interpreted as evidence for a change in the torus triggered by a volcanic outburst. (Right) Comparison of the brightness of the wide sodium nebula and emitted thermal power revealing a (putative) correlation (Mendillo et al. 2004)
Fig. 3
Fig. 3
Left: Voyager volcanism discovery image through scattering by plume dust: Pele on the sunlight left, Loki at the terminator (NASA PIA00379). Middle: Visible image of Io in eclipse from the New Horizons spacecraft showing emissions from both hot spots (bright and round) and excited gases above volcanic sites like the plume of Tvastar above the north pole and from the global atmosphere as equatorial spots on the left and right. Right: S2 and SO2 plume gas absorption measurements by the Hubble Space Telescope (Spencer et al. 2000)
Fig. 4
Fig. 4
Thermal continuum (left) and SO gas emission (right) observed by JWST at 1.7 μm (de Pater et al. 2023). The SO gas emission is localized to Kanehekili Fluctus, which was producing significant thermal emission at the time of observation. Prior detections of the same SO band did not find a clear correlation between SO emissions and active thermal hot spots
Fig. 5
Fig. 5
Simultaneous volcanic thermal emission and gas emission observations. 3.8-μm image of Io on UT 2022 May 24 ∼ 15 UT from Keck/NIRC2, with contours overlain for SO2 and NaCl gas distributions from simultaneous ALMA observations (at 430.194 and 428.519 GHz for the two molecules respectively), showing the lack of spatial correspondence between the NaCl gas (presumed to be a tracer of plumes) and active hot spots. The southern hot spot that shows the closest spatial alignment with enhanced NaCl emission is around 49S 106W, where an unnamed patera P197 is located. White represents the peak in the thermal emission, and white contours are the maximum gas densities. The arrow indicates the direction of Io’s north pole. ALMA data from de Kleer et al. (2024); Keck data: https://www2.keck.hawaii.edu/inst/tda/TwilightZone.html
Fig. 6
Fig. 6
Timeline of Na nebula emission during the spring of 2015 alongside the thermal emission for several individual volcanoes that could have plausibly contributed. Data from Yoneda et al. (2015), de Kleer and de Pater (2016), and de Pater et al. (2016)
Fig. 7
Fig. 7
SO2 column density map inferred from several Lyman-α observations of absorption in the dayside atmosphere. Above 60°N/S the observations are not sensitive to the low abundances. At the equator even higher column densities are consistent with the data (Giono and Roth 2021)
Fig. 8
Fig. 8
Seasonal variation of the dayside SO2 column density on the Anti-Jovian side (monitored over almost two Jupiter years or 22 Earth years, from Giles et al. 2024). The dash–dotted line shows the best-fit seasonal model, combining the vapor-pressure equilibrium (dotted line) and a constant component (solid line). There is no evidence for unsystematic, transient changes
Fig. 9
Fig. 9
Maps of dayside SO2 emissions while Io moves into and out of eclipse. The emissions clearly decrease in shadow but the remaining SO2 signal suggests a volcanic outgassing contribution between 30% and 50%. The sunlit maps confirm the concentration of the densest atmosphere around the equator (from de Pater et al. , based upon observations from de Pater et al. 2020b)
Fig. 10
Fig. 10
Overview of escape processes and the magnetospheric environment surrounding Io. Bottom: Various processes near the exobase (dashed gray line) can lead to escape from Io’s atmosphere which populates the neutral clouds (slower atomic or molecular neutrals), neutral nebulae (faster neutrals), or the plasma torus (ionized atomic or molecular particles). Top: Ionization of the neutral clouds is the main source for the plasma torus. Loss from the torus is primarily through radial transport to the plasma sheet and other magnetospheric exchange processes. (Credit: Márton Galbács/Lorenz Roth/KTH)
Fig. 11
Fig. 11
(Left) Atmospheric density (decreasing with altitude) and temperature profiles with exobase altitudes (horizontal dotted) for two cases, corresponding to two different assumed temperature profiles (hot and cold) from Summers and Strobel (1996). (Right) DSMC modeling results of a large plume rising above the exobase in this simulated (not heated) atmosphere (McDoniel et al. 2017). (Note this may be different for higher exobase cases)
Fig. 12
Fig. 12
(Left) 3D sketch of the plasma environment around Io. (Right) Processes in Io’s atmosphere in the plane perpendicular to Jupiter’s background magnetic field; the top of the figure is towards Jupiter. Credit: S. Bartlett adapted from Bagenal and Dols (2020)
Fig. 13
Fig. 13
Various total rates within Io’s atmosphere as a function of atmospheric content in units of surface density (adapted from Saur et al. 2003). The range of commonly accepted equatorial atmospheric densities is shown by the shaded gray area
Fig. 14
Fig. 14
(Left). Local UV emission of the oxygen O I 135.6 nm line taken with the Hubble Space Telescope (HST). The emission is dominated by two bright spots near Io’s magnetic equator, i.e., perpendicular to Jupiter’s background magnetic field B. The number at the lower left corner describes the sub-observer longitude (from Roth et al. 2014). (Right) Sketch of the interactions of Jupiter’s moons with the magnetosphere. Turquoise lines display Jupiter’s magnetic field lines, purple tubes show Alfvén wings connecting the moons with Jupiter. The inset on the lower left shows HST observations of the auroral footprints of the moons in Jupiter’s atmosphere resulting from particle acceleration within the Alfvén wings (Image Credit: J. Spencer and J. Clarke)
Fig. 15
Fig. 15
Images of Io’s sodium cloud features, with labels identifying their different spatial scales. Adapted from Burger et al. (1999), Mendillo et al. (1990), Schneider et al. (1991)
Fig. 16
Fig. 16
Modeled SO2, SO, S, & O neutral toroidal clouds in the vicinity of Io’s orbit from a perspective looking down onto the orbital plane (Smith et al. 2022). Due to the longer lifetime, oxygen atoms populate the complete orbit around Jupiter, with O densities exceeding the density of S, SO2, and SO (except for the region very close to Io hardly resolved here)
Fig. 17
Fig. 17
Neutral densities, relative ion densities and emitted power for different torus ion species modeled and inferred from Cassini UVIS observations from Delamere et al. (2004), Fig. 9. The declining emission intensities are consistent with a transient enhancement (before the measurements started) in neutral source rate
Fig. 18
Fig. 18
Io plasma torus and Jovian UV aurora variability from the end of November 2014 to the middle of May 2015. (a) Optical emission in the sodium nebula in Rayleigh units, (b–f) neutral oxygen and ion (OI 130.4 nm, S II 76.5 nm, O II 83.4 nm, S III 67.9 nm, and S IV 65.7 nm) brightness. (g) Brightness of Jupiter’s aurora from 124 to 145 nm, relative to System-III longitude-dependent brightness averaged over 2014–2015 (Tsuchiya et al. 2018)
Fig. 19
Fig. 19
(a) (left) Schematic diagram of the mass and energy flow through the Io plasma torus (Bagenal and Delamere, 2011). (b) (right) The neutral source rate and outward transport loss timescale derived from the Hisaki observations in 2015 (Hikida et al. 2020)
Fig. 20
Fig. 20
Schematic illustration of the effect of Io’s volcanic activity enhancement on the Jovian magnetosphere divided into five time-phases (left part, from Tsuchiya et al. 2018). From normal steady state (1), increase in plasma supply to the plasma torus as the phase (2), thermal plasma originating from Io (dark and light green areas) extends, followed by enhanced outward transport (blue arrow) of Io-genic thermal plasma (3) and inward injection of hot plasma (orange arrow) (4). Then return to the normal steady state (5). Several auroral variations during the event time are shown (right part). Change of the magnetic structure is not shown for simplicity. See the text and Tsuchiya et al. (2018) for further details
Fig. 21
Fig. 21
(Left) Calculated dust emission rate of Io using Galileo observations. Triangles and crosses denote the maxima and minima derived from measurements when the Galileo spacecraft was at distances of 13–30 RJ to Jupiter, respectively. The dashed line is for the G28 orbit when Galileo was at distances of 30–280 RJ, dotted lines show the remaining orbits with distances of 30–400 RJ. Horizontal bars indicate periods when large-area surface changes occurred on Io, arrows indicate individual plume sightings. Note that the duration of the eruptions is not known. Galileo flybys are indicated at the bottom. From Krüger et al. (2003b). (Right) The clear correlation of the Na+ (measured in data feature F3 on y axis) with Cl+ (black solid) ions in the Cassini measurements suggest NaCl as a major dust component (from Postberg et al. 2006)
Fig. 22
Fig. 22
Schematic depiction of causal connections in the Io-Jupiter system. Solid arrows show connections that include flow of substantial mass. Dashed arrows indicate connections primarily through energy exchange (e.g., sputtering by energetic particles, injections of hot plasma into the inner magnetosphere, or energization for powering aurora). The asterisk indicates the mass transfer, for which the early studies (Sect. 2.1) constrained the rate (∼1 ton/s) that has become the canonical number (Sect. 4.2). The stability of Io’s atmosphere and the processes possibly enabling large changes in the atmosphere loss (green arrows) are key factors in the connecting chain that are not understood

References

    1. Ackley PC, Hoey WA, Trafton LM, Goldstein DB, Varghese PL (2021) Hybrid dust-tracking method for modeling Io’s Tvashtar volcanic plume. Icarus 359:114274. 10.1016/j.icarus.2020.114274
    1. Austin JV, Goldstein DB (2000) Rarefied gas model of Io’s sublimation-driven atmosphere. Icarus 148(2):370–383. 10.1006/icar.2000.6466
    1. Badman SV, Bonfond B, Fujimoto M, Gray RL, Kasaba Y, Kasahara S, et al. (2016) Weakening of Jupiter’s main auroral emission during January 2014. Geophys Res Lett 43(3):988–997. 10.1002/2015GL067366
    1. Bagenal F (1994) Empirical model of the Io plasma torus: Voyager measurements. J Geophys Res Space Phys 99(A6):11043–11062. 10.1029/93JA02908
    1. Bagenal F (1997) The ionization source near Io from Galileo wake data. Geophys Res Lett 24(17):2111–2114. 10.1029/97GL02052

LinkOut - more resources