. 2025 Feb 6;16(10):4490-4500.
doi: 10.1039/d4sc06459c. eCollection 2025 Mar 5.

Debut of enzyme-responsive anionic cyanine for overlap-free NIR-II-to-I dual-channel tumour imaging

Affiliations

Debut of enzyme-responsive anionic cyanine for overlap-free NIR-II-to-I dual-channel tumour imaging

Feiyi Chu et al. Chem Sci. .

Abstract

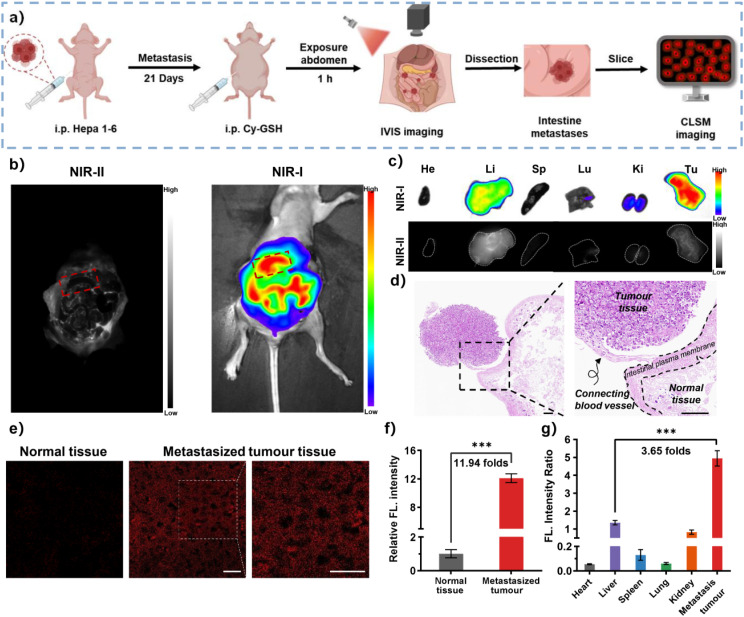
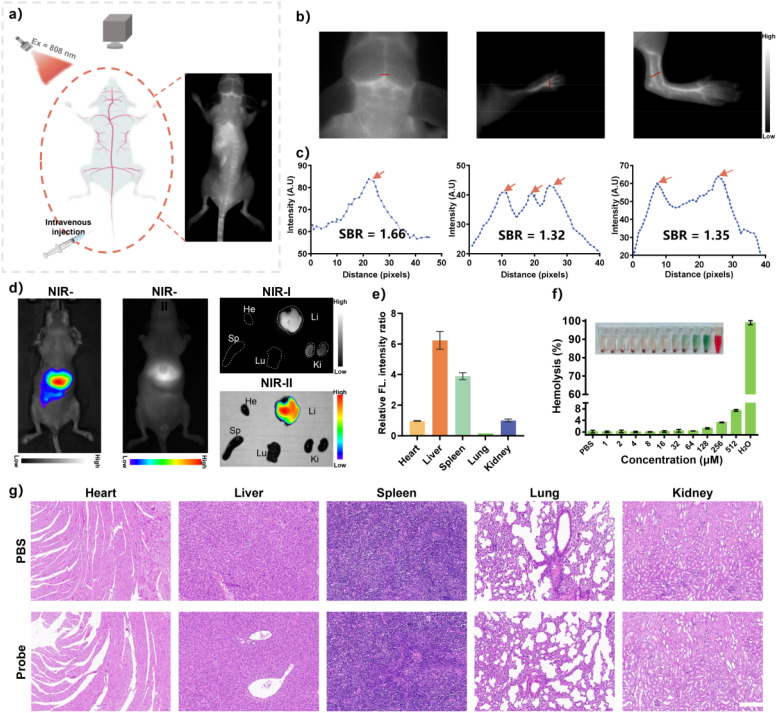
Bridging the disparity between traditional surgical resection imaging and ex vivo histopathology, fluorescence imaging is considered a promising tool in disease diagnosis and imaging navigation. Nevertheless, its usefulness is undermined by the variability of single-wavelength fluorescence signals and limited penetration of NIR-I (650-900 nm) bioimaging. In this work, we present a novel NIR-II ratiometric fluorescent probe (CFC-GSH) with γ-glutamyl transpeptidase (GGT) sensitivity for multifunctional bioimaging. This probe leverages a GSH-capped anionic cyanine, with advantages of high brightness, excellent photostability, high specificity and favourable biocompatibility. CFC-GSH exhibits an intrinsically stable NIR-II signal prior to triggering, which can be utilized for in vivo systemic circulation vessel outlining and microvascular imaging. At the tumour site with GGT over expression, an intramolecular S,N-rearrangement would initiate the conversion of sulphur-substituted cyanine to amino-substituted cyanine, resulting in a significant emission shift of 270 nm. Using the dual-channel signal changes, CFC-GSH effectively differentiates between subcutaneous hepatocellular carcinoma (HCC) and normal tissue and precisely localizes metastatic HCC tumours in the abdominal cavity. These results reveal that CFC-GSH exhibits promising potential as a multiprospective candidate tool for fluorescence screening and diagnostic imaging in various biological scenarios.


Conflict of interest statement

There are no conflicts to declare.

Figures

Scheme 1
Scheme 1. Schematic diagram of NIR-II transpeptidase-triggered fluorescent probe CFC-GSH for multifunctional bioimaging. The anionic cyanine conjugate CFC-GSH exhibited an intrinsic NIR-II signal prior to activation by transpeptidases, which can be used for fluorescence angiography of systemically circulating vascular profiles. At the tumour site, the probe exhibited an unprecedented emission shift from NIR-II to NIR-I, enabling accurate hepatocellular carcinoma (HCC) surveillance.
Fig. 1
Fig. 1. (a) Absorption spectra of CFC-GSH (5 μM) in the absence (A) and presence (B) of GGT (100 U per L). (b) NIR-II (λex = 808 nm) and (c) NIR-I (λex = 620 nm) fluorescence spectra of CFC-GSH (5 μM) in the presence of different concentrations of GGT (0–100 U per L) for 30 min. (d) The linear relationship between the fluorescence intensity ratio (F660/F930) of CFC-GSH (5 μM) and GGT activity (0–100 U per L). (e) NIR-II (upper panel, λex = 808 nm) and NIR-I (lower panel, λex = 605 nm) fluorescent images of CFC-GSH (5 μM) to (A) PBS, (B) GGT (80 U per L), (C) GGT (80 U per L) + acivicin (0.2 mM), (D) GGT (80 U per L) + acivicin (0.5 mM), and (E) GGT (80 U per L) + acivicin (1 mM). (f) Fluorescence intensity ratio (F660/F930) of the groups in (e). (g) Time-dependent NIR-II (upper panel, λex = 808 nm) and NIR-I (lower panel, λex = 605 nm) fluorescent images of CFC-GSH (5 μM) in the presence of GGT (80 U per L) at different times (0–40 min). (h) Kinetic time curve for the fluorescence intensity ratio (F660/F930) of CFC-GSH (5 μM) incubated with GGT (80 U per L). Data are presented as mean ± s.d. (n = 3).
Fig. 2
Fig. 2. (a) Schematic illustration of the sensing mechanism of CFC-GSH for GGT. (b) Molecular docking simulation of the binding mode of CFC-GSH to the catalytic pocket of GGT. (c) Frontier molecular orbital of probe CFC-GSH and amino-substituted product CFC-NCS.
Fig. 3
Fig. 3. Fluorescence imaging of (a) normal cells, HCC and (b) other cancer cells incubated with CFC-GSH (5 μM, 0.5% DMSO) for 30 min and then treated with Hoechst (1 μM) for another 5 min. (J–L) Hepa 1–6, (P–R) HepG2 cells in (a) (D–F) SKOV3, (J–L) A549, and (P–R) HepG2 cells in (b) pretreated with acivicin (1 mM) for 30 min. Blue channel: λex = 405 nm and λem = 430–480 nm; red channel: λex = 620 nm and λem = 650–700 nm. Scale bar: 10 μm. (c) NIR-II (upper panel, λex = 808 nm) and NIR-I (lower panel, λex = 605 nm) fluorescence images of CFC-GSH (5 μM, 0.5% DMSO) upon incubation with Hepa 1–6 cells at 37 °C for 30 min. (d) Relative fluorescence intensity of CFC-GSH-incubated cells in (a) and (b) and the intensity of image B in (a) are set as 1.0. (e) The corresponding quantitative analysis of ratiometric fluorescence intensity in (c). Data are presented as mean ± s.d. (n = 3).
Fig. 4
Fig. 4. (a) NIR-I (λex = 605 nm, λem = 660 nm) and NIR-II (λex = 808 nm, 1075 nm LP) fluorescence imaging of tumour-bearing BALB/c nude mice at different times (1, 5, 10, 20, 30, 40, and 60 min) after intratumoural injection of CFC-GSH (50 μL, 10 μM in PBS) without/with pretreatment of acivicin (1 mM) for another 30 min. (b) NIR-I and NIR-II fluorescence imaging of the isolated organs from the mice in (a). (c–e) Time-dependent quantitative statistics of (c) NIR-I and (d) NIR-II fluorescence intensity, and (e) the corresponding fluorescence intensity ratio of the mice in (a). (f) Quantitative biodistribution analysis of the mean fluorescence intensity ratio in tumours and major organs. Data are presented as mean ± s.d. (n = 3). ****p < 0.0001.
Fig. 5
Fig. 5. (a) Schematic diagram of constructing and identifying abdominal tumour metastases in BALB/c nude mice. (b) In vivo NIR-I (λex = 605 nm, λem = 660 nm) and NIR-II (λex = 808 nm, 1075 nm LP) fluorescence imaging of the dissected mice bearing Hepa 1–6 abdominal tumour metastases after intraperitoneal injection CFC-GSH (100 μL, 20 μM in PBS) for 1 h. (c) Ex vivo NIR-I and NIR-II fluorescence imaging of the organs and peritoneal metastasized tumours isolated from the mice. (d) H&E staining of the tumour margins on the mesentery. Scale bars: 100 μm. Fluorescence confocal images (e) and the corresponding relative fluorescence intensity (f) of CFC-GSH (100 μL, 10 μM in PBS) in normal intestinal and metastases tissue slices. Scale bar: 20 μm. (g) The corresponding quantitative statistics of the mean fluorescence intensity ratio of the isolated organs in (c). Data are presented as mean ± s.d. (n = 3). ***p < 0.001.
Fig. 6
Fig. 6. (a) Schematic of vascular imaging and the NIR-II fluorescence image within living mice after i.v. injection of CFC-GSH (200 μL, 80 μM in PBS), acquired in the prostrate (λex = 808 nm, 1075 nm LP). (b) NIR-II vascular imaging of the brain, paw and hindlimb after i.v. injection of CFC-GSH. (c) The corresponding cross-sectional fluorescence intensity profiles were measured along positions marked by the red lines in the three ROI regions in (b). (d) NIR-I (λex = 605 nm) and NIR-II (λex = 808 nm) fluorescence images of the mice and the isolated organs (heart, liver, spleen, lung, and kidney) after intravenous injection with CFC-GSH (200 μL, 80 μM in PBS) for 24 h. (e) The corresponding relative quantitative statistics of the mean fluorescence intensity ratio of the isolated organs in (d) and the ratio of the kidney are set at 1.0. (f) Homolysis rate of CFC-GSH at different concentrations from 1 to 512 μM incubated with red blood cells for 2 h at 37 °C, using pure water as a positive control and PBS buffer as a negative control. (g) H&E staining of vital organs (heart, liver, spleen, lung, and kidney) harvested from mice after intravenous injection with PBS or CFC-GSH for 24 h, respectively. Scale bar: 200 μm. Data are presented as mean ± s.d. (n = 3).

References

    1. Zhang Y. Zhang Z. Wu M. Zhang R. ACS Meas. Sci. Au. 2024;4:54–75. doi: 10.1021/acsmeasuresciau.3c00045. - DOI - PMC - PubMed
    1. Feng B. Chu F. Fang Y. Liu M. Feng X. Dong J. Chen F. Zeng W. Chem. Sci. 2024;15:7324–7331. doi: 10.1039/D4SC00487F. - DOI - PMC - PubMed
    1. Chen C. Zhang X. Gao Z. Feng G. Ding D. Nat. Protoc. 2024;19:2408–2434. doi: 10.1038/s41596-024-00990-4. - DOI - PubMed
    1. Qi J. Duan X. Cai Y. Jia S. Chen C. Zhao Z. Li Y. Peng H.-Q. Kwok R. T. K. Lam J. W. Y. Ding D. Tang B. Z. Chem. Sci. 2020;11:8438–8447. doi: 10.1039/D0SC03423A. - DOI - PMC - PubMed
    1. Lou H. Ji A. Qu C. Duan S. Liu H. Chen H. Cheng Z. Chem. Eng. J. 2022;449:137848–137856. doi: 10.1016/j.cej.2022.137848. - DOI

LinkOut - more resources